



Global Supply Chain Volatility Index
August 2026
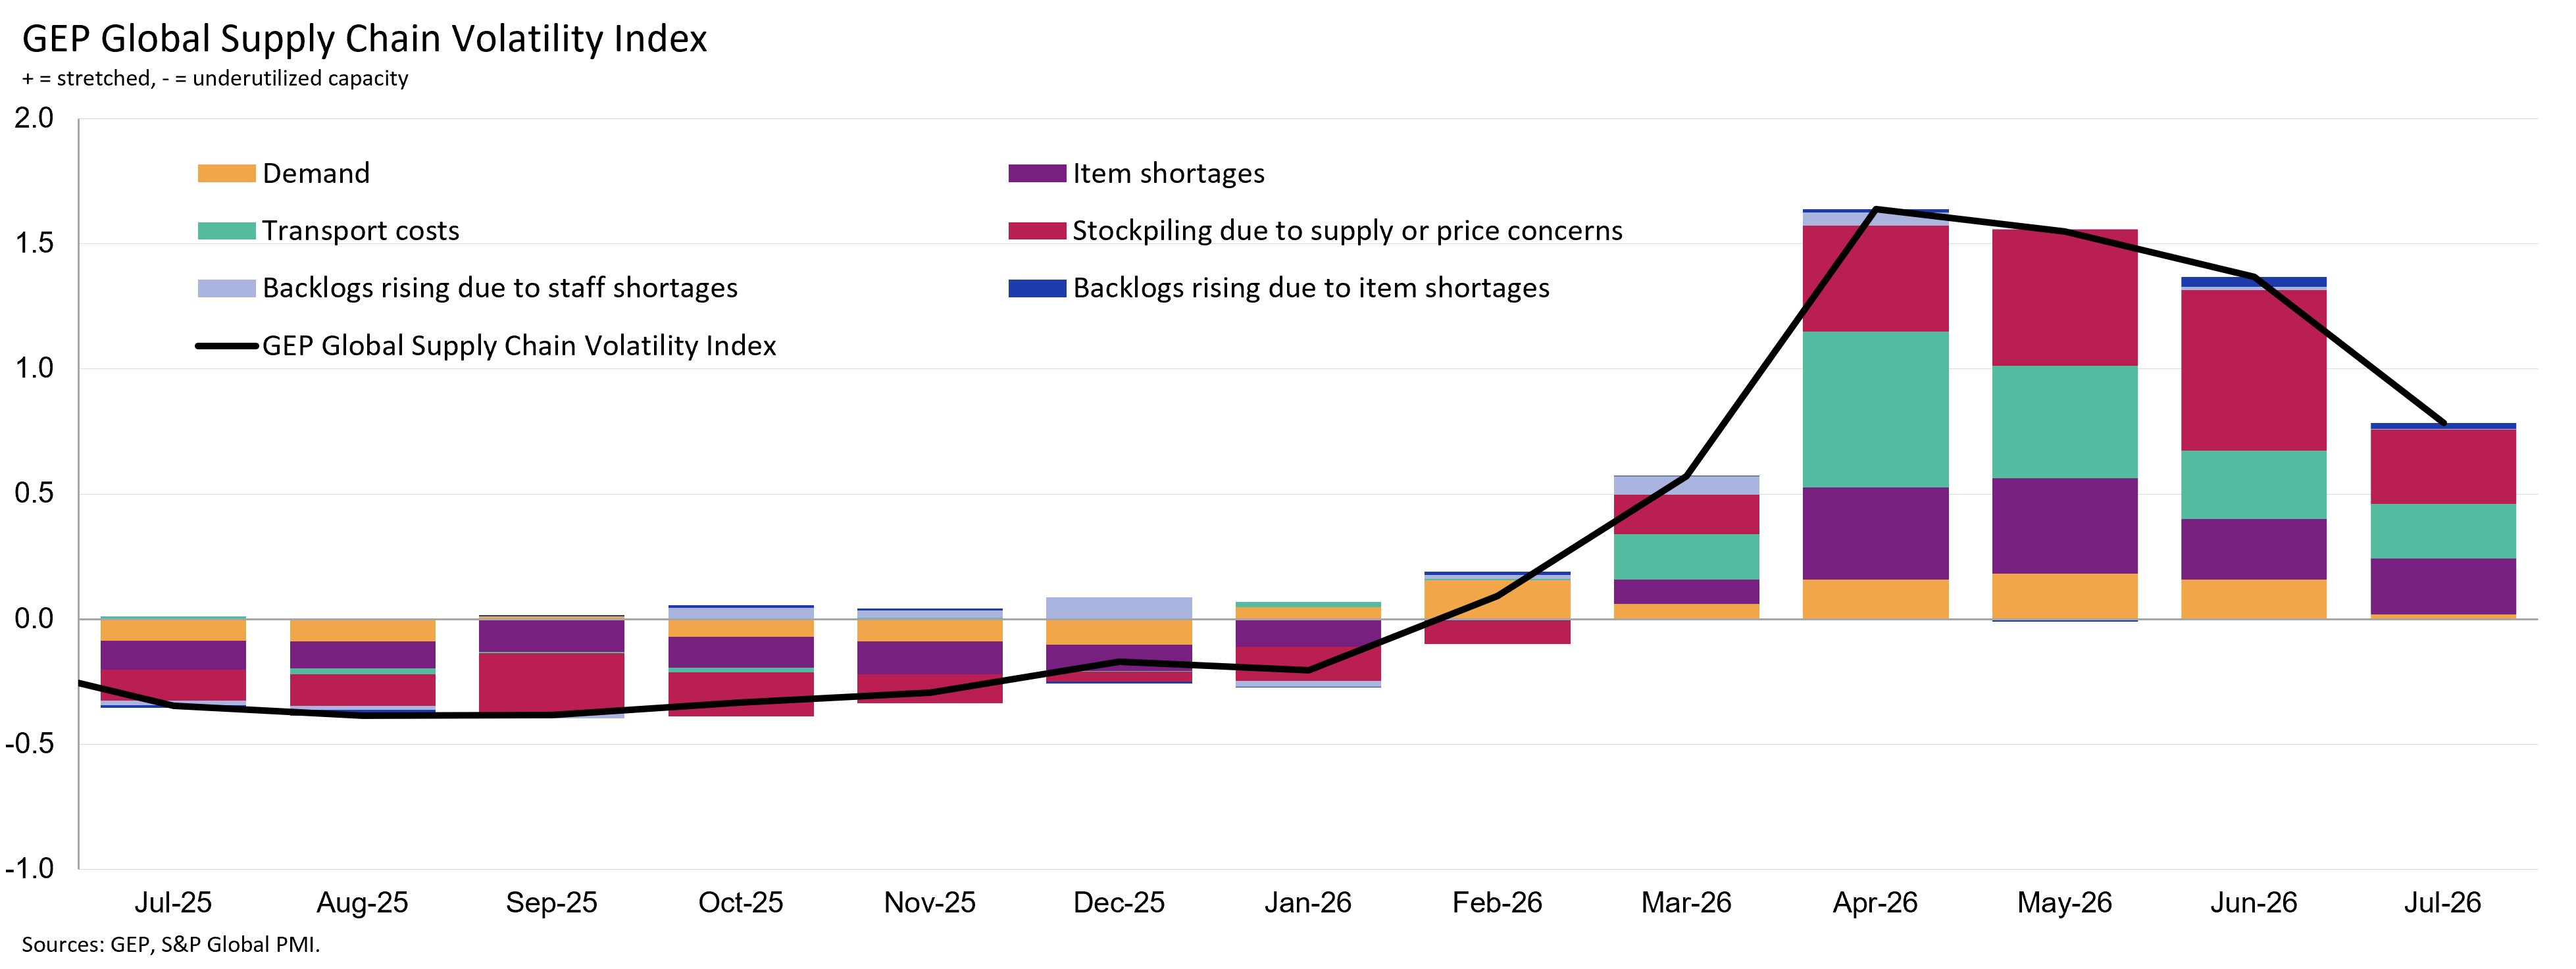
Global: 0.78
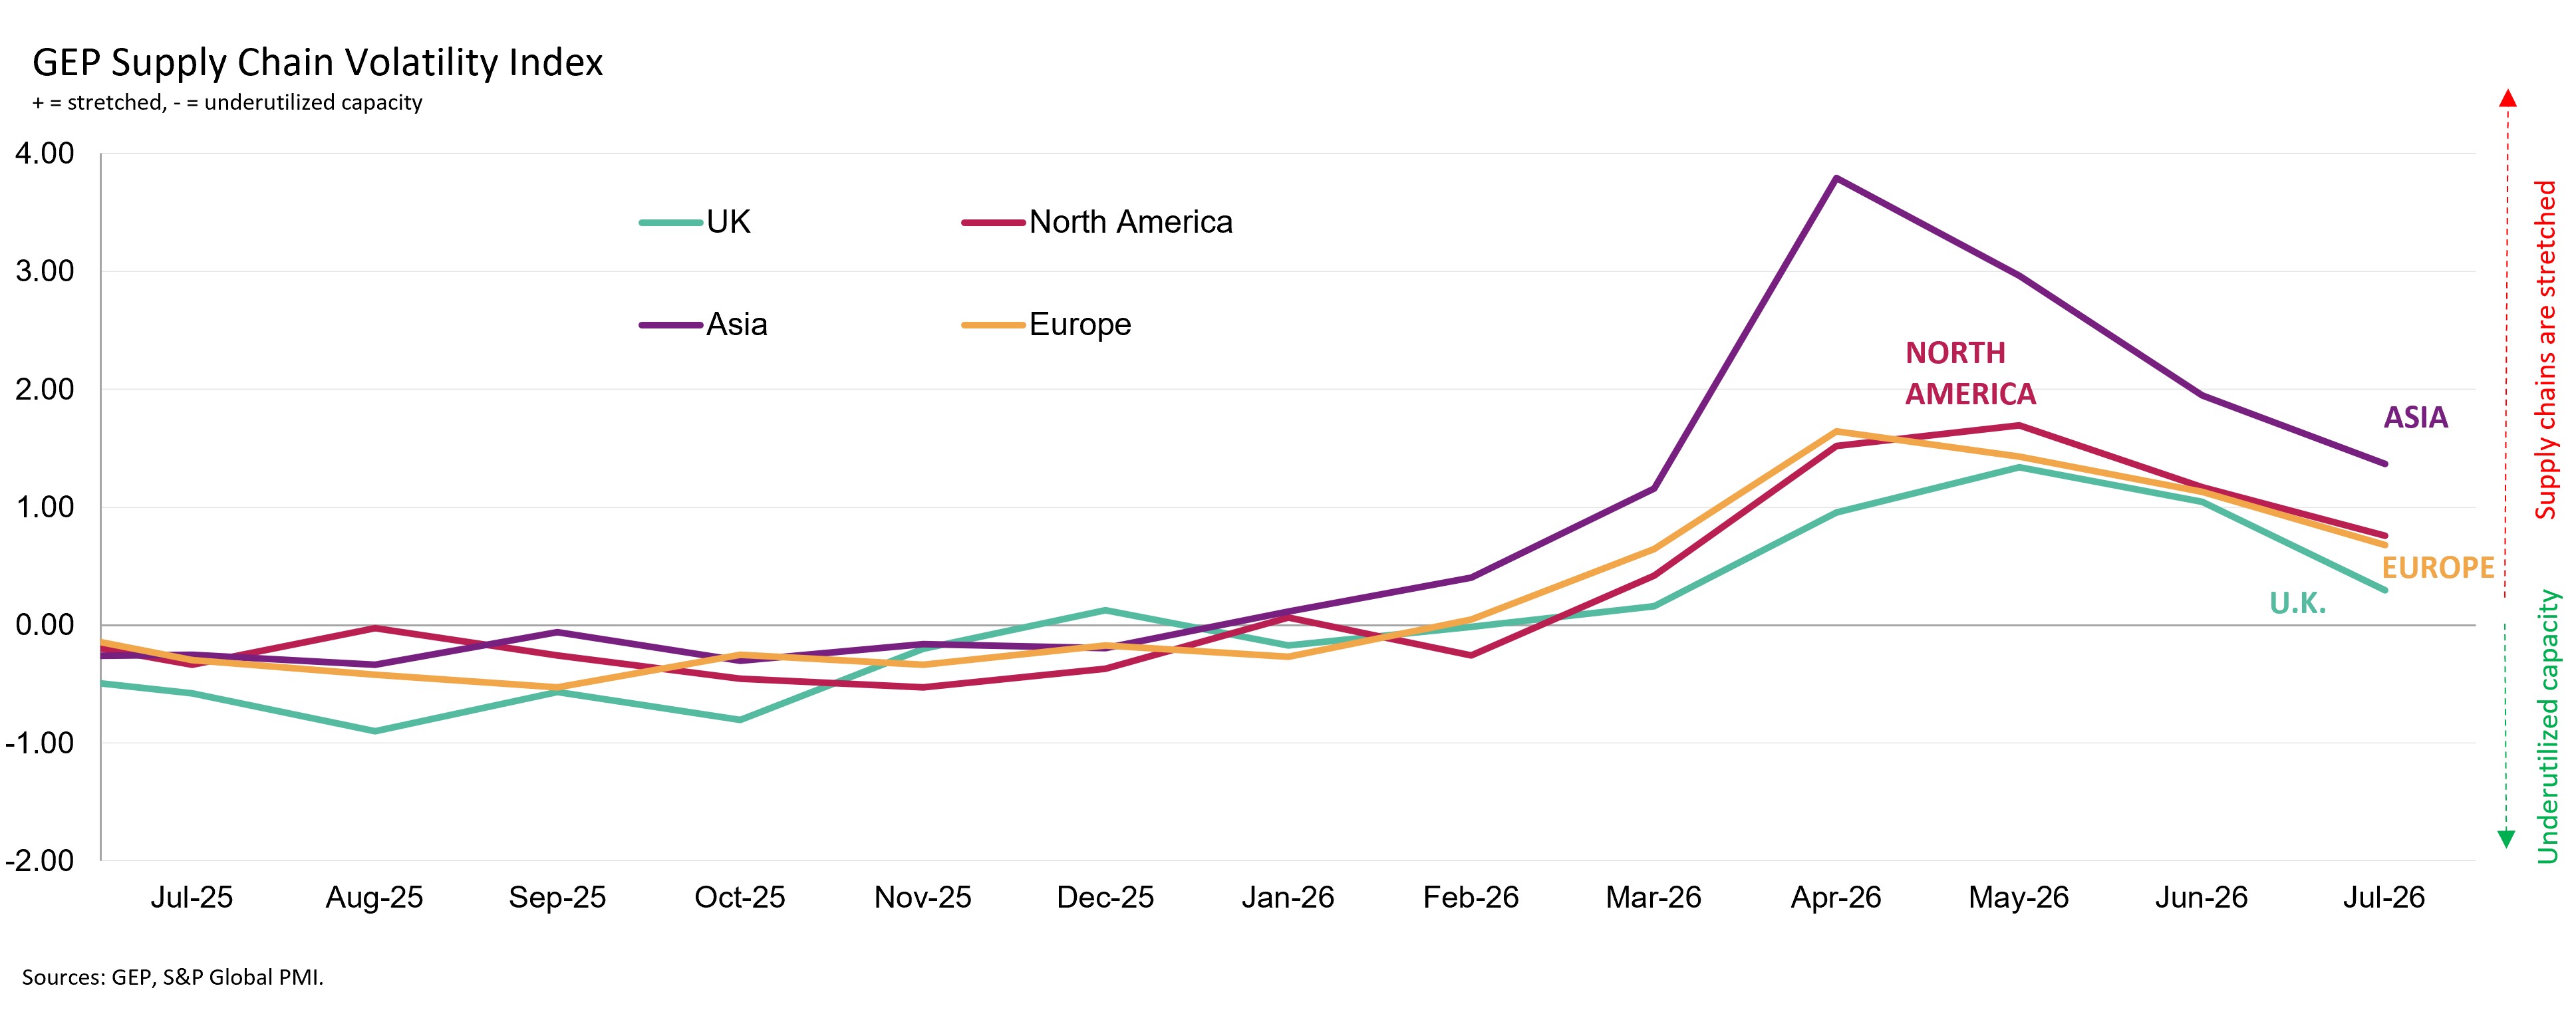
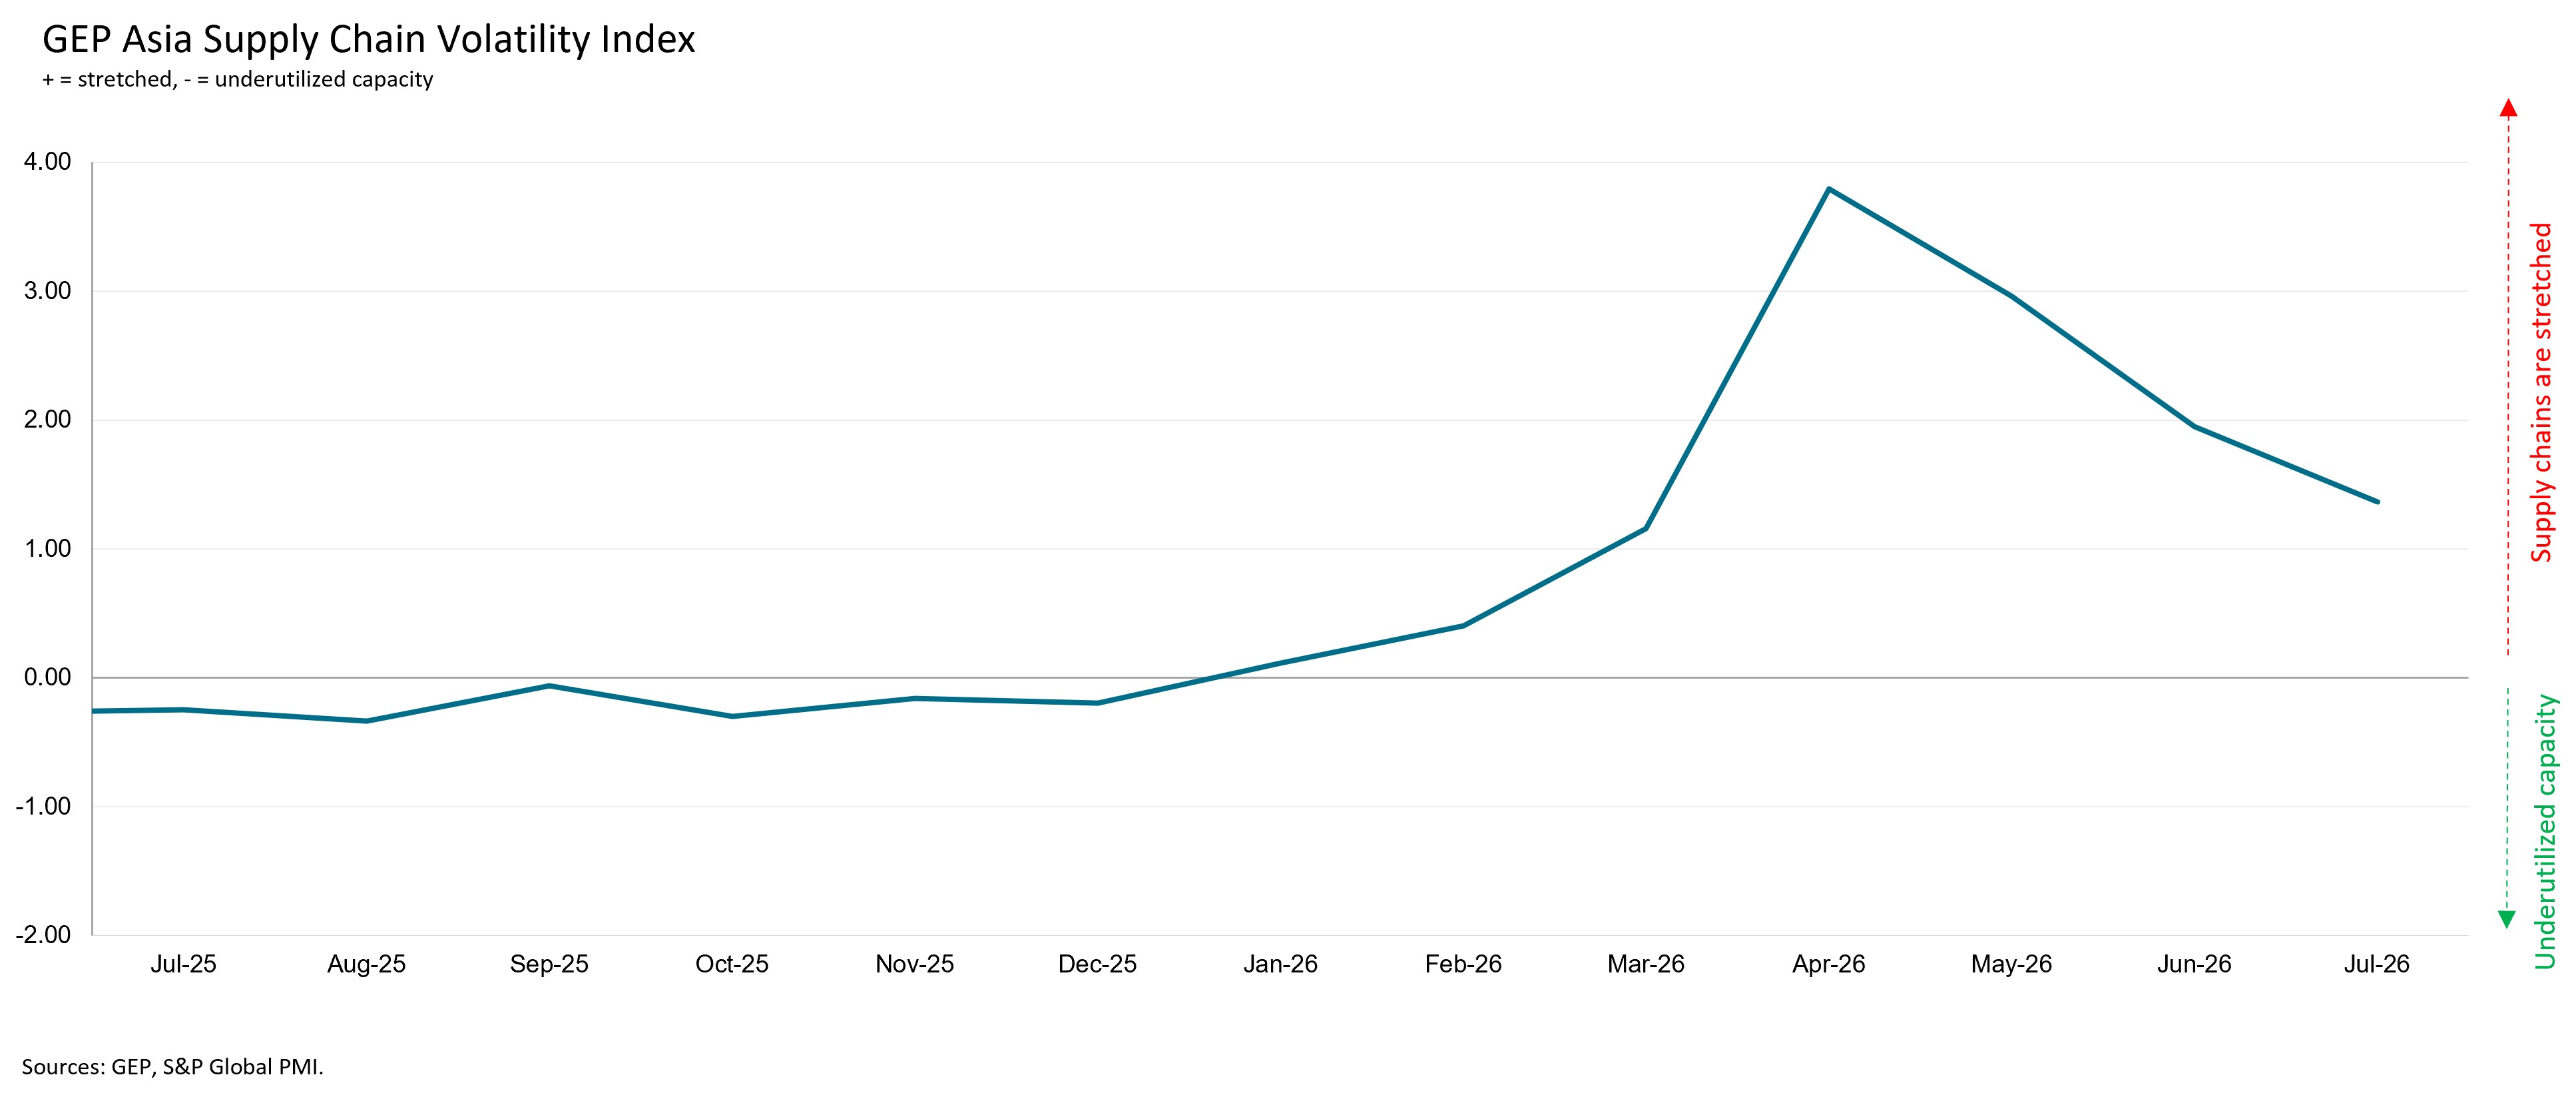
Asia: 1.37 -0.58
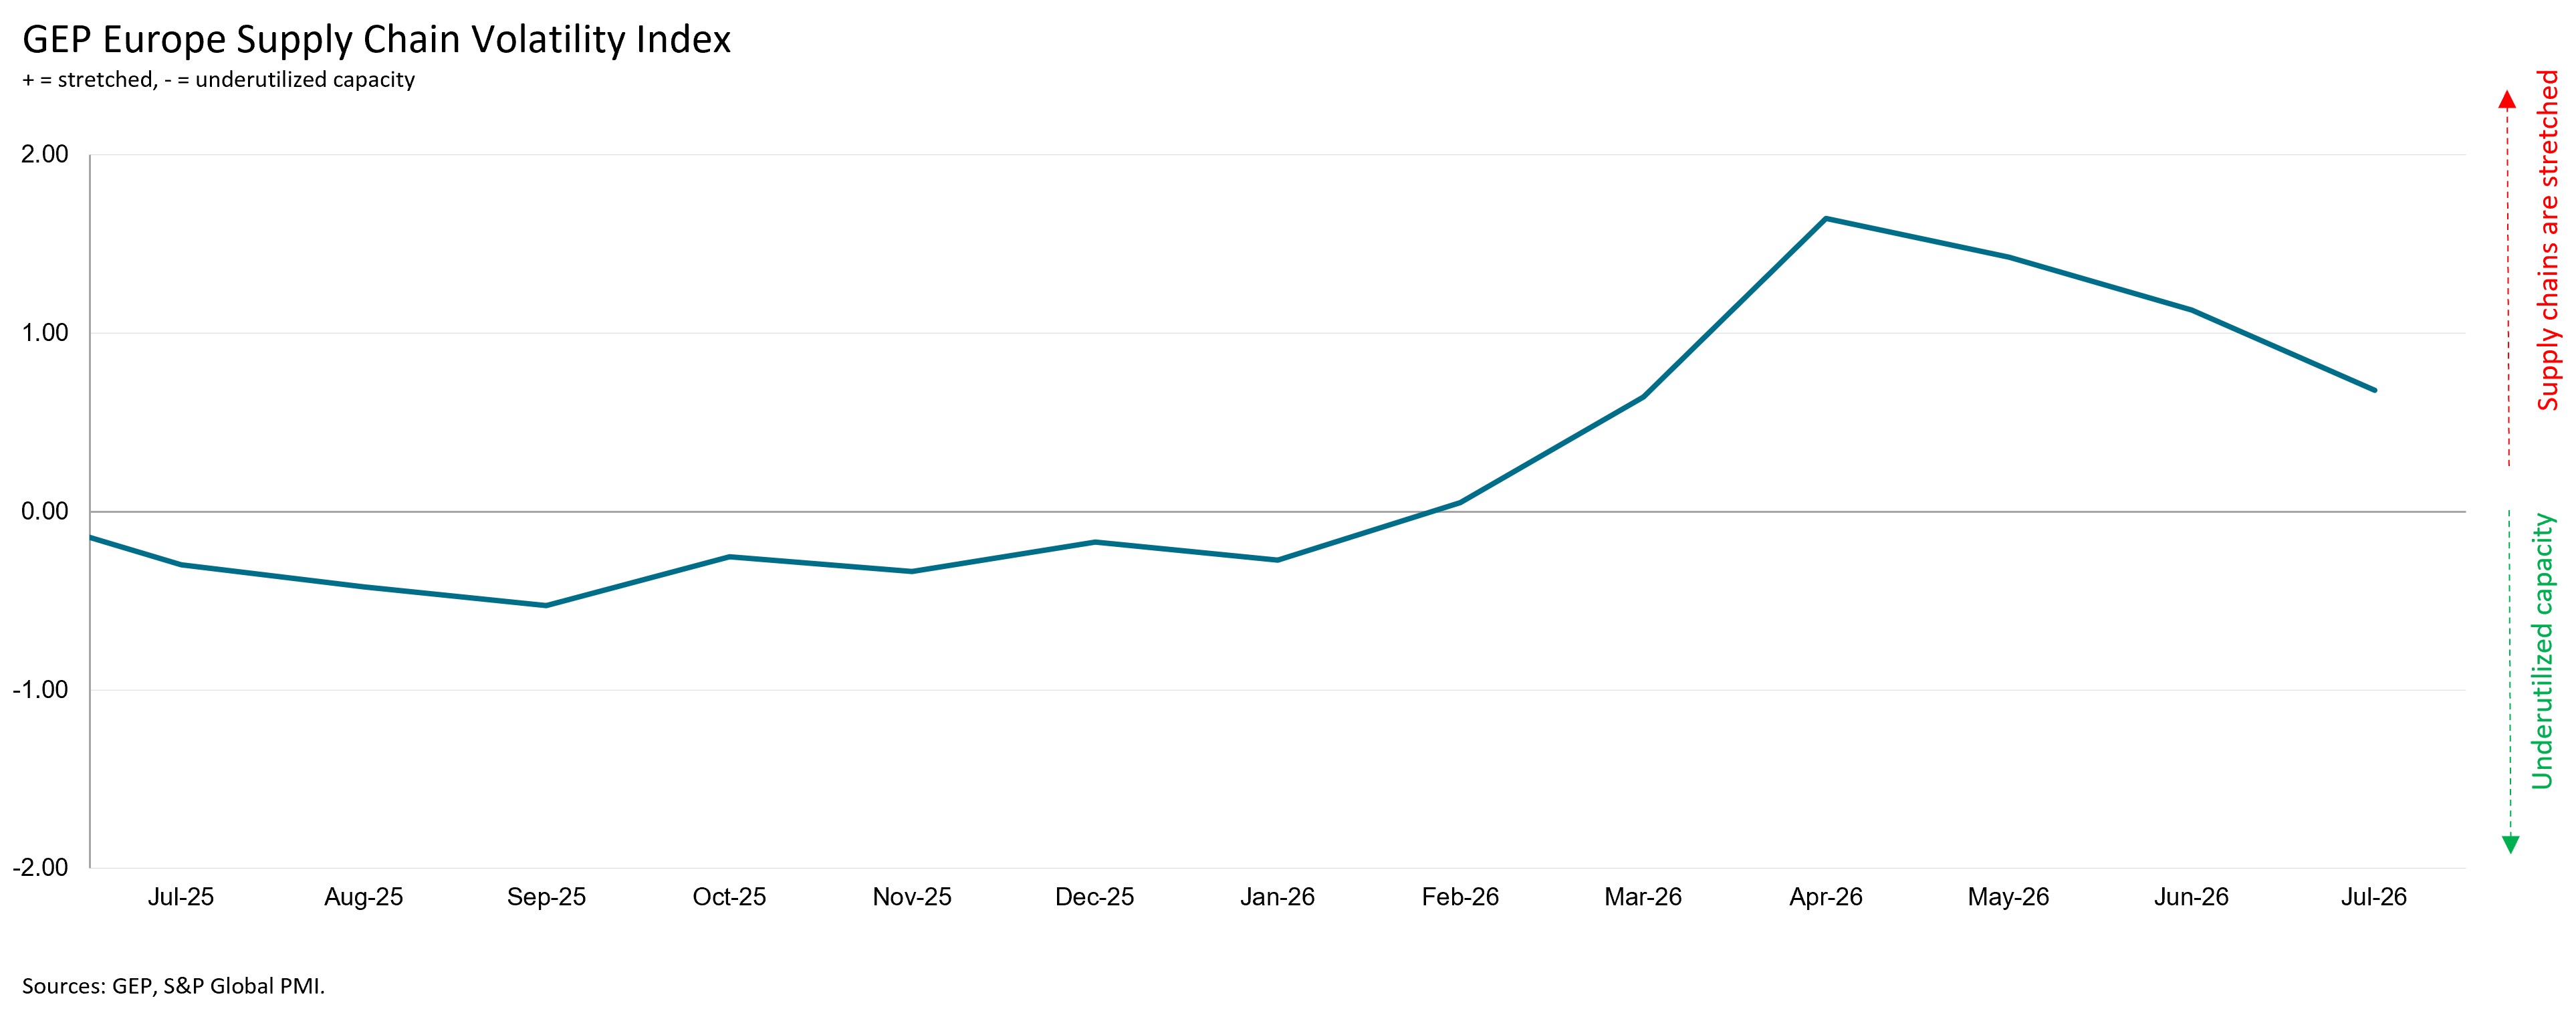
EU: 0.68 -0.45
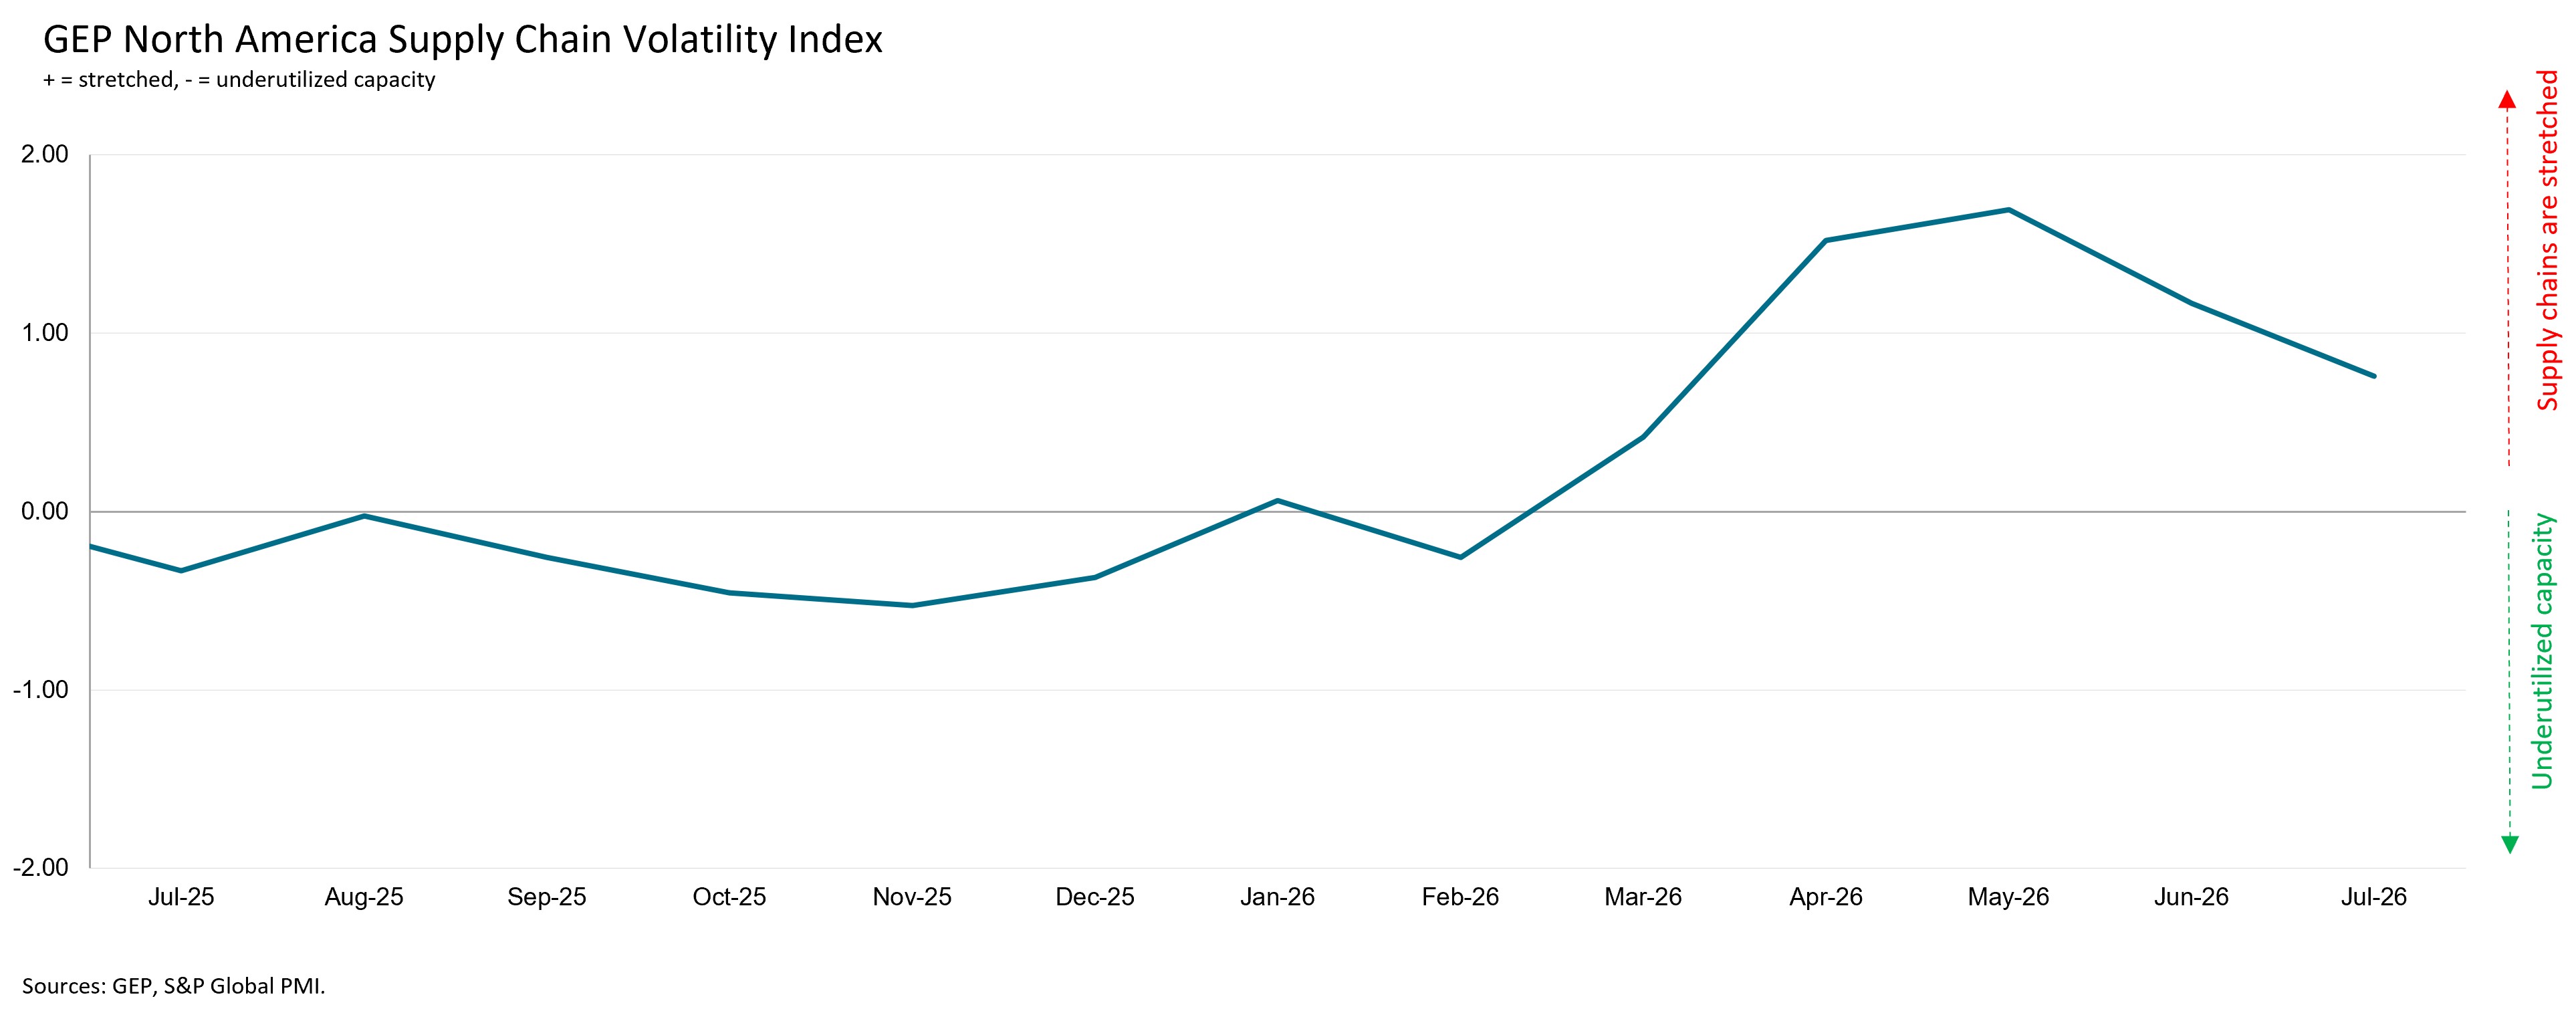
NA: 0.76 -0.41
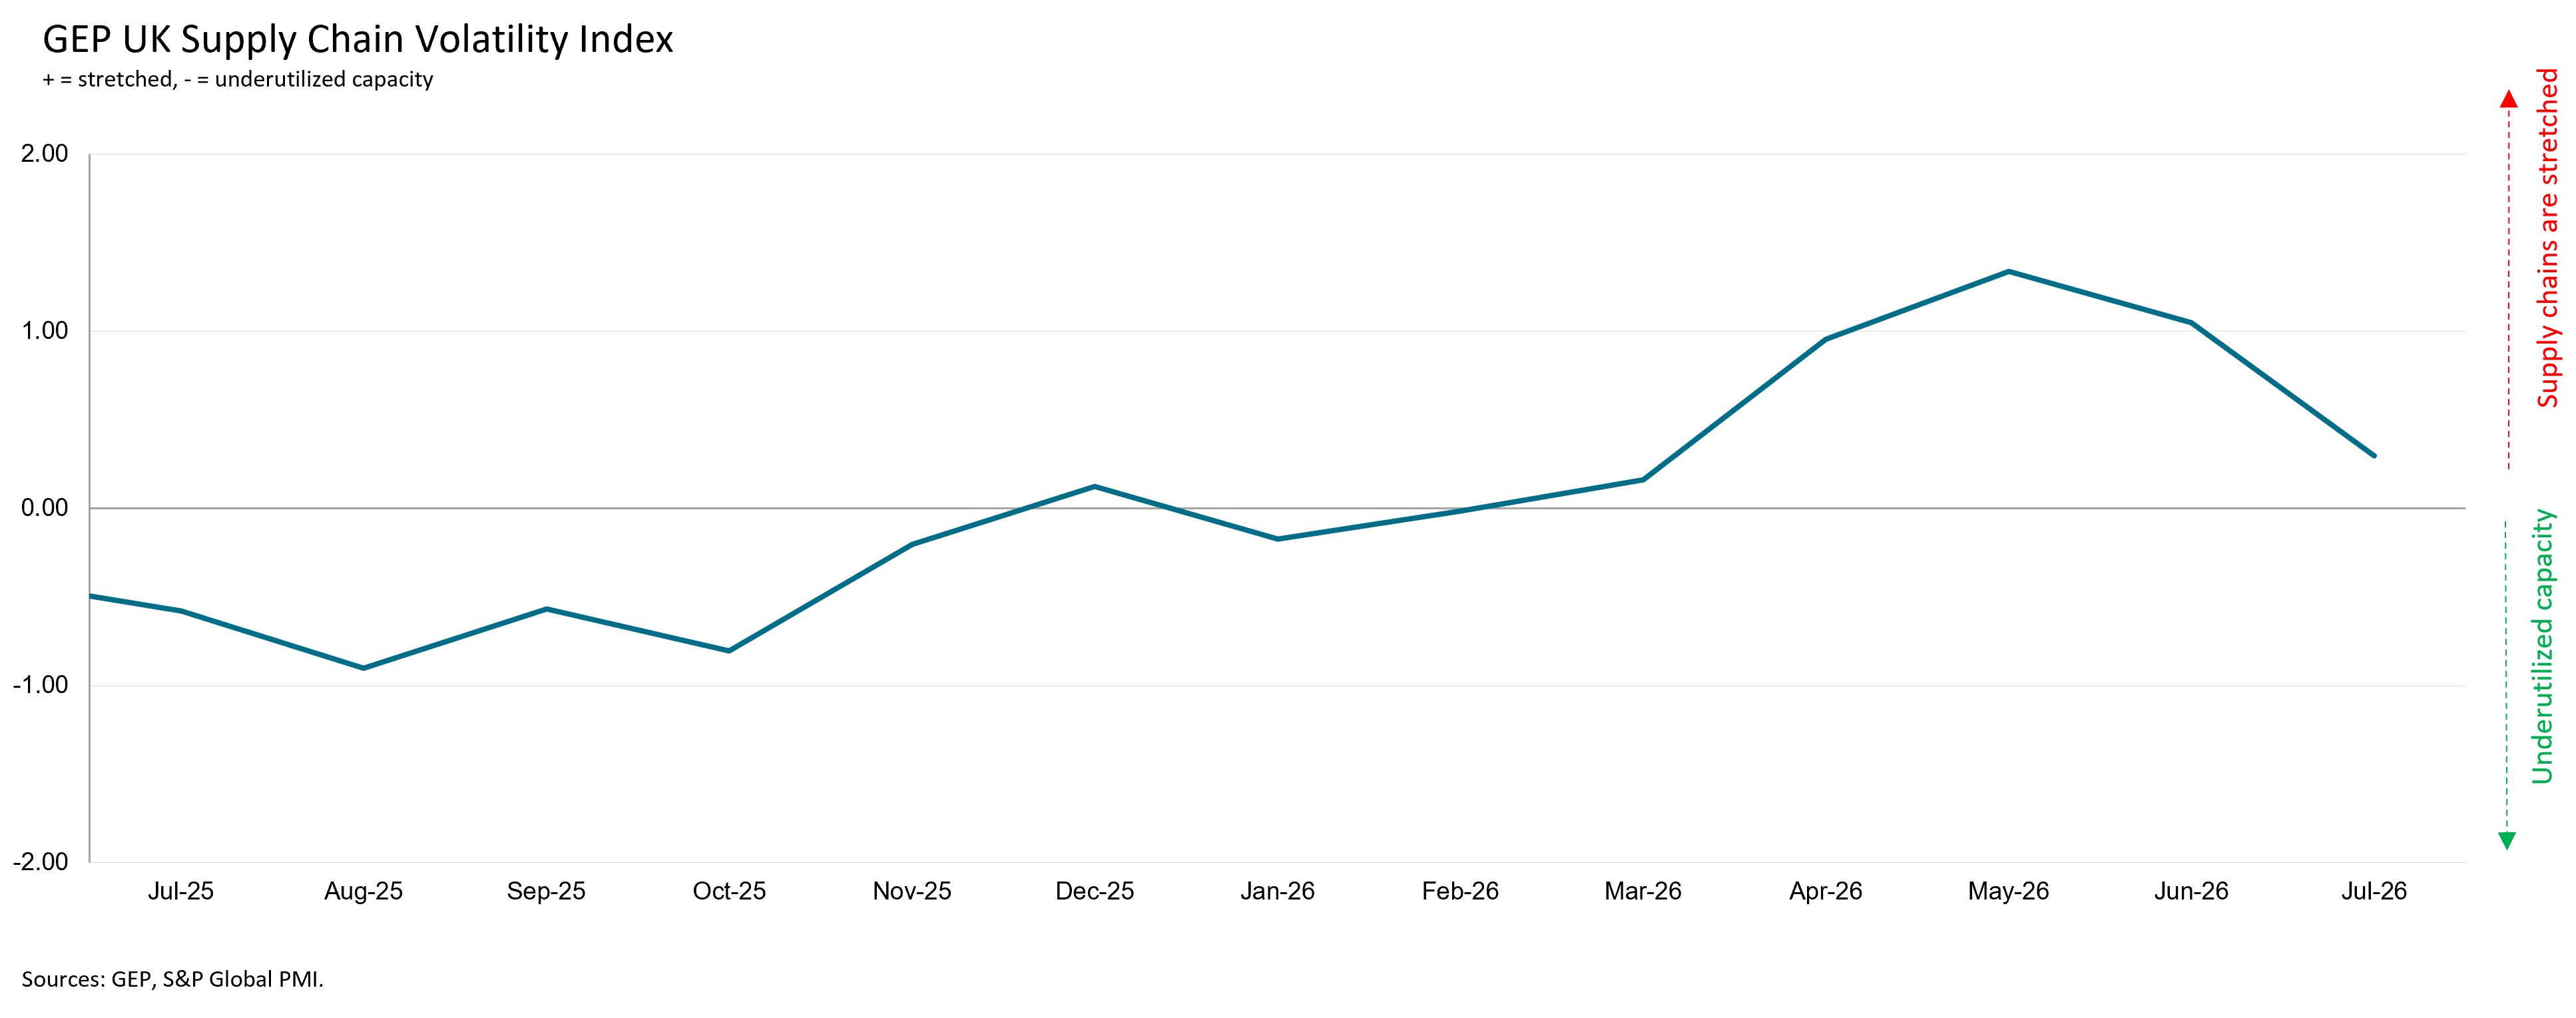
U.K.: 0.30 -0.75
GLOBAL SUPPLY CHAIN PRESSURES EASE IN JULY, BUT SHORTAGES PERSIST AHEAD OF RENEWED STRAIT OF HORMUZ DISRUPTION: GEP GLOBAL SUPPLY CHAIN VOLATILITY INDEX
- Demand for intermediate goods and raw materials stagnated in July as manufacturers reduced safety-stock building.
- Supply shortages remained elevated, leaving production vulnerable to fresh geopolitical shocks.
- Asia continued to lead global manufacturing demand, while Europe continued to lag. more...
GEP Global Supply Chain Volatility Index
-0.58
August 2026
Asia: 1.37
EU: 0.68
NA: 0.76
U.K.: 0.30
Interpreting the data:
When the SCVI > 0, supply chain capacity is being stretched. The further above 0, the more stretched supply chains are.
When the SCVI < 0, supply chain capacity is being underutilized. The further below 0, the more underutilized supply chains are.
Asia: Remains the world's busiest manufacturing region despite slower purchasing activity, led by a slowdown in China.
Europe: Demand weakened further as manufacturers cut purchasing.
U.K.: Manufacturers sharply reduced procurement activity and aggressively ran down inventories.
North America: Supply chain pressures eased as manufacturers reduced purchasing activity; Shortages of critical inputs continued to constrain production.
The next release of the GEP Global Supply Chain Volatility Index will be 8 a.m. ET, Sept. 11, 2026.
About the GEP Supply Chain Volatility Index
The GEP Global Supply Chain Volatility Index is produced by S&P Global and GEP. The GEP Global Supply Chain Volatility Index is derived from S&P Global’s PMI™ surveys, sent to companies in over 40 countries, totalling around 27,000 companies. These countries account for 89% of global gross domestic product (GDP) (source: World Bank World Development Indicators).
The headline figure is the GEP Global Supply Chain Volatility Index. This a weighted sum of six sub-indices derived from PMI data, PMI Comments Trackers and PMI Commodity Price & Supply Indicators compiled by S&P Global.
The GEP Global Supply Chain Volatility Index is calculated using a weighted sum of the z-scores of the six indices. Weights are determined by analysing the impact each component has on suppliers’ delivery times through regression analysis.
The six variables used are 1) JP Morgan Global Quantity of Purchases Index, 2) All Items Supply Shortages Indicator, 3) Transport Price Pressure Indicator and Manufacturing PMI Comments Tracker data for 4) stockpiling due to supply or price concerns, and backlogs rising due to 5) staff shortages and 6) item shortages.
A value above 0 indicates that supply chain capacity is being stretched and supply-chain volatility is increasing. The further above 0, the greater the extent to which capacity is being stretched.
A value below 0 indicates that supply chain capacity is being underutilized, reducing supply-chain volatility. The further below 0, the greater the extent to which capacity is being underutilized.
A Supply Chain Volatility Index is also published at a regional level for Europe, Asia, North America and the UK. The regional indices measure the performance of supply-chains connected to those parts of the world.
For more information on PMI surveys, PMI Comments Trackers and PMI Commodity Price & Supply Indicators, the GEP Supply Chain Volatility Index methodologies, please contact economics@ihsmarkit.com.