MANUFACTURERS RAMP UP PURCHASING IN SEPTEMBER AS GLOBAL DEMAND STRENGTHENS: GEP GLOBAL SUPPLY CHAIN VOLATILITY INDEX
- Global purchasing activity growth climbed close to its 2026 high, pointing to firmer manufacturing output in Q4
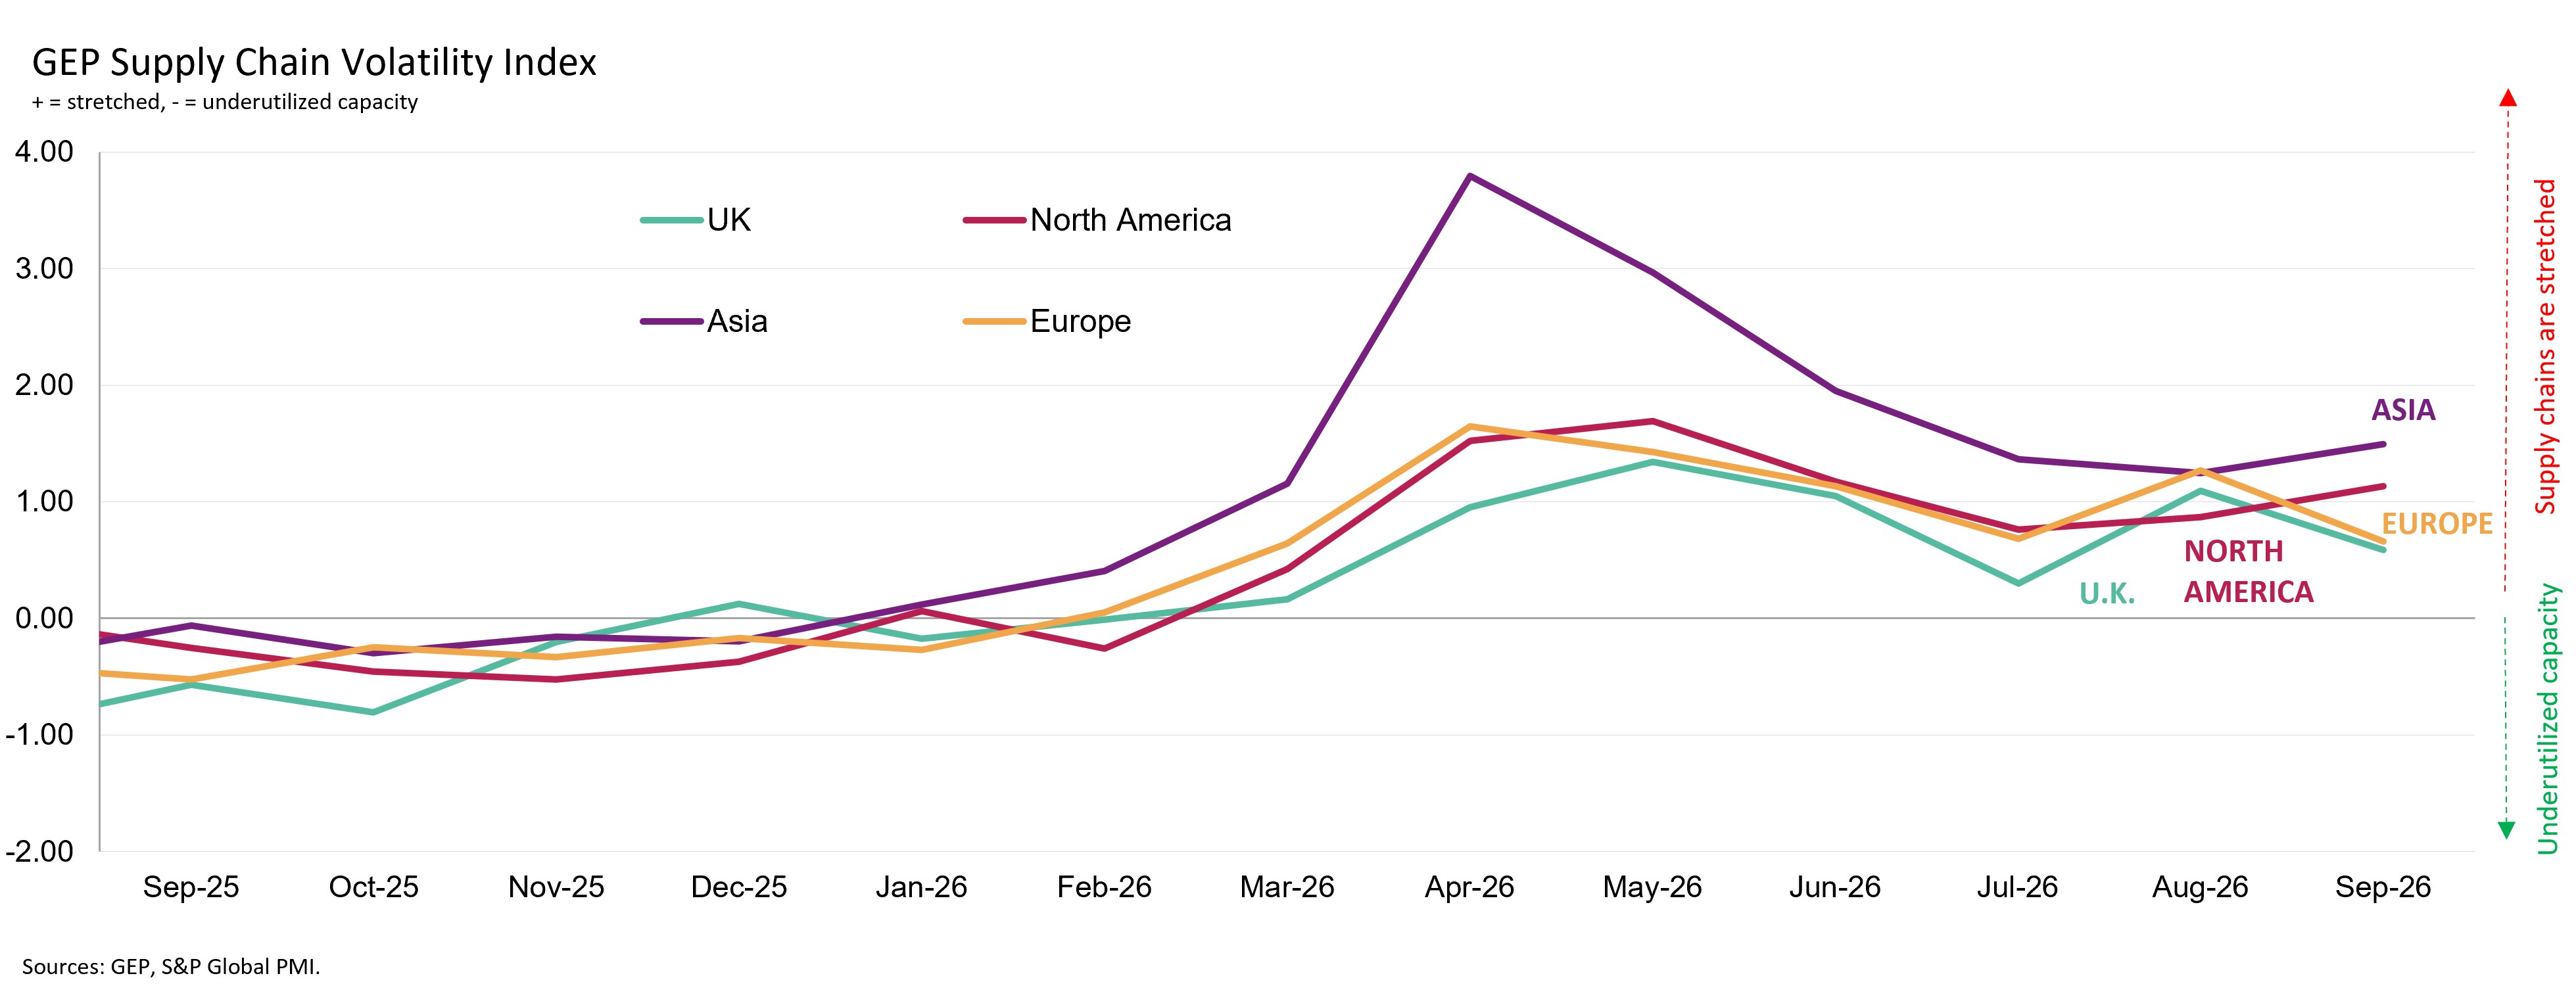
- All three major regions register stronger purchasing, with the U.S., Germany, Taiwan and South Korea seeing accelerated factory buying in particular
- Supply shortages increase for the first time since May as intensified energy crisis hits oil and oil-based products
Clark, N.J., Oct 12, 2026 – GEP Global Supply Chain Volatility Index — a leading indicator tracking demand conditions, shortages, transportation costs, inventories and backlogs, based on a monthly survey of 27,000 businesses — showed global manufacturers ramping up purchases of raw materials and components in September as underlying demand strengthened.
Global input demand growth rose to its strongest since May and was close to its 2026 high, signaling firmer manufacturing activity heading into the fourth quarter. Purchasing strengthened across North America, Asia and Europe, with particularly strong increases in the United States, Germany, Taiwan and South Korea.
At the same time, supply pressures intensified. Shortages increased for the first time since May, while global transportation costs also rose. Shortages of oil and oil-based products were particularly acute, creating renewed cost and availability pressures for manufacturers.
“Manufacturers are buying more because demand is strengthening, but they’re doing so at a time when shortages and transportation costs are starting to rise again,” said John Piatek, vice president, consulting, GEP. “For companies, that means the priority shifts from simply protecting inventory to securing supply and controlling costs. If demand continues to build through the fourth quarter, businesses that wait will face tighter availability and higher input costs.”
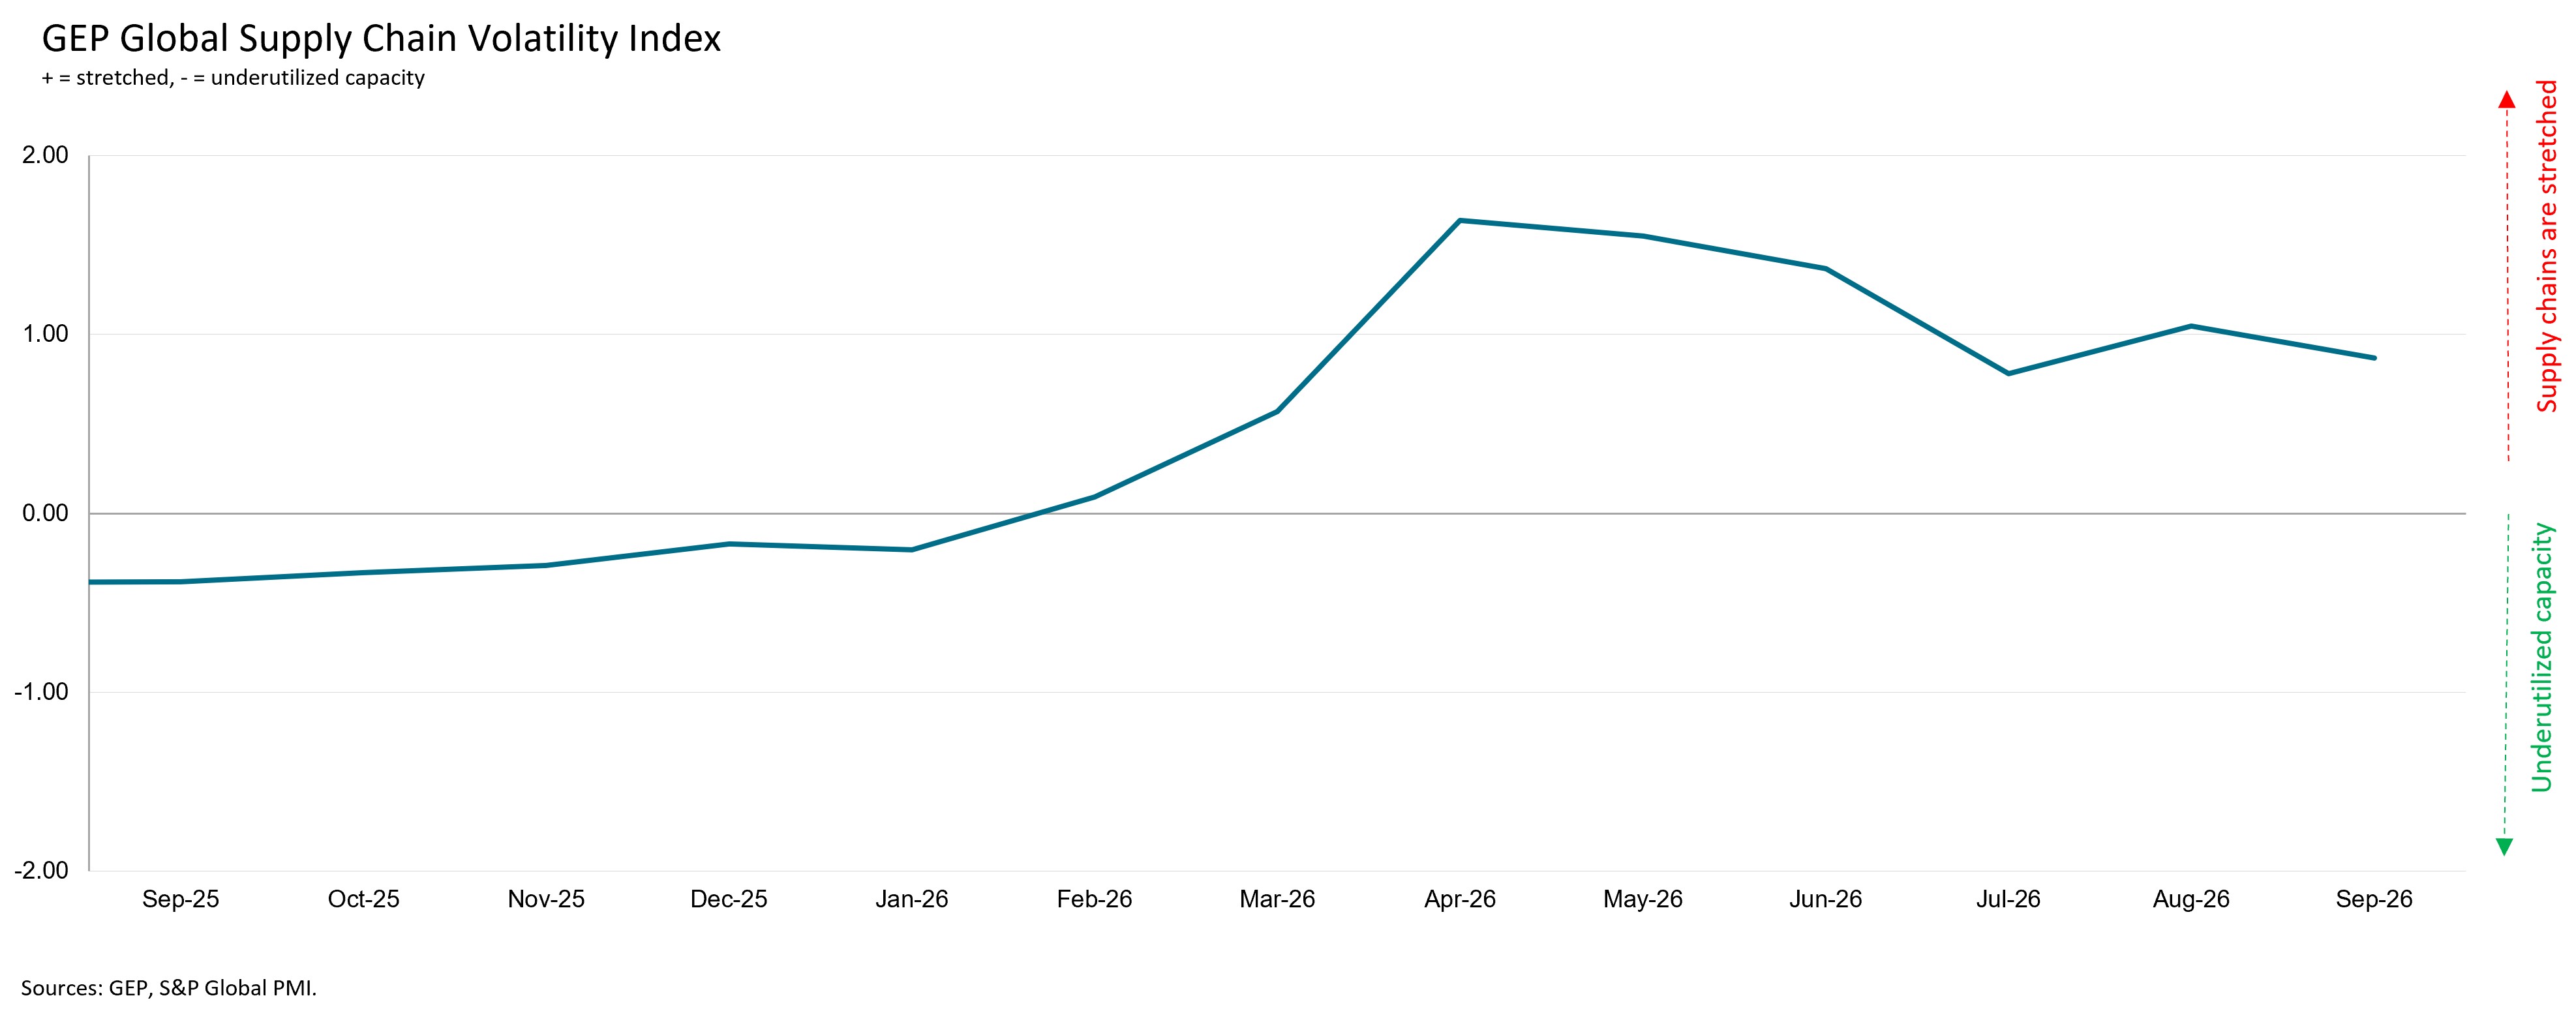
Interpreting the data:
Index > 0, supply chain capacity is being stretched. The further above 0, the more stretched supply chains are.
Index < 0, supply chain capacity is being underutilized. The further below 0, the more underutilized supply chains are.
SEPTEMBER 2026 REGIONAL KEY FINDINGS
- ASIA: Index rose to 1.49, from 1.24, a three-month high, as stronger demand from Asian factories coincided with tighter supply conditions.
- NORTH AMERICA: Index rose to 1.13, from 0.87, its highest level since June, driven by a resurgence in the U.S. manufacturing economy.
- EUROPE: Index falls sharply to 0.66, from 1.27, indicating lowest level of supply-chain disruption across the continent since March.
- U.K.: Index drops to 0.59, from 1.10, as U.K. manufacturers pare back stockpiling activity, alleviating supply pressure.
SEPTEMBER 2026 KEY FINDINGS
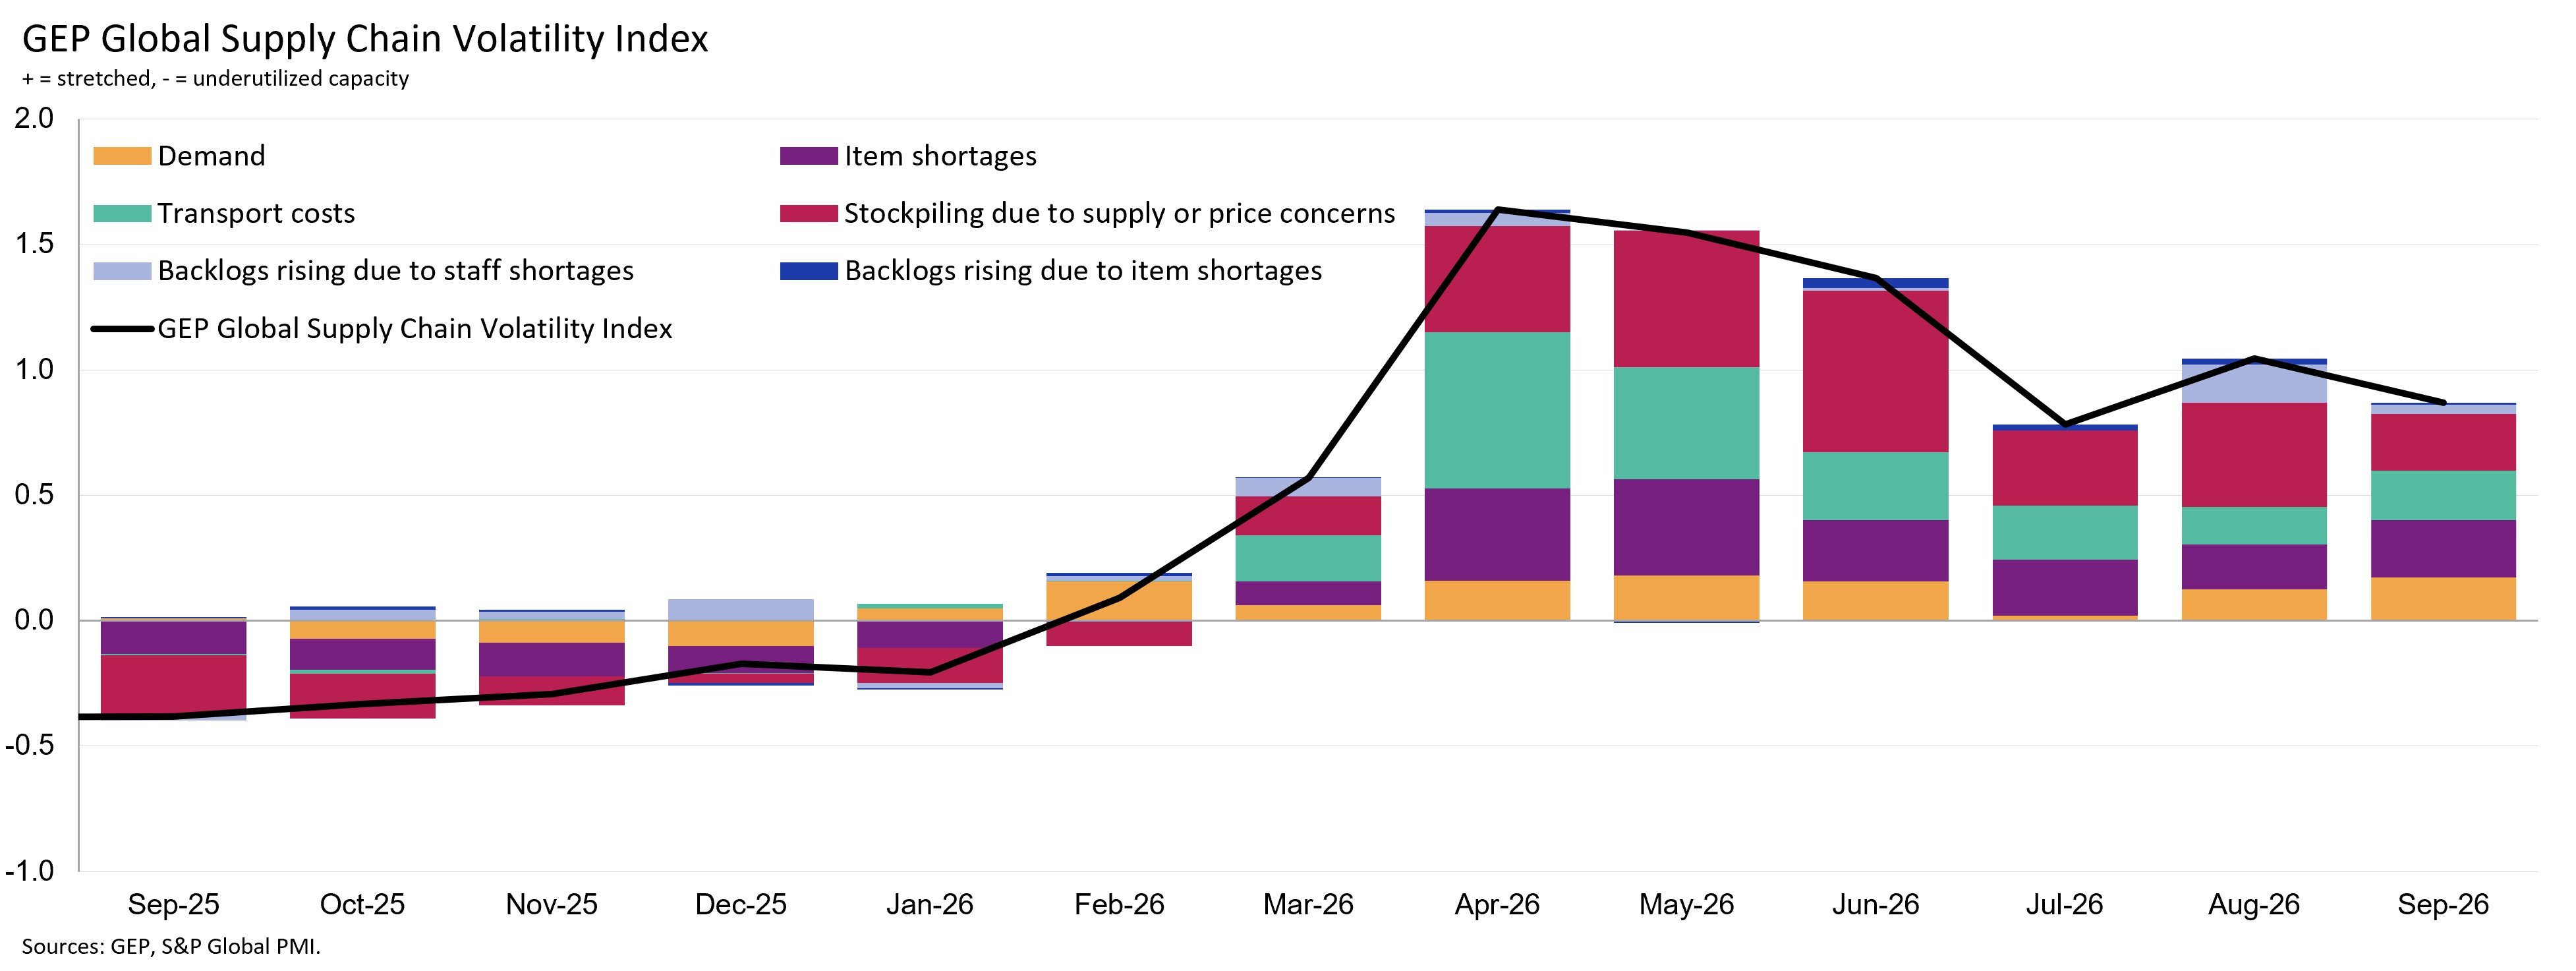
- DEMAND: Global manufacturers purchased more raw materials, commodities and components in September. In fact, the rate of growth rose to a four-month high and was close to its 2026 high, reflecting stronger buying activity across many large industrial players such as the U.S., Germany, South Korea and Taiwan.
- INVENTORIES: Reports of safety buffers being added to inventories fell further during September, marking a sustained reduction since peaking in June. They were still historically high overall, however, signaling that global procurement managers still preferred to hold excesses on hand to mitigate inflation and shortages.
- MATERIAL SHORTAGES: The items in short supply indicator rose in September for the first time since May, indicating a worsening of availability for critical manufacturing inputs. Underlying data revealed a marked rise in shortages for oil and oil-based products.
- LABOR SHORTAGES: Reports of backlogged orders increasing due to staff shortages fell in September, signaling that workforce capacity was less of a constraint on global supply chains.
- TRANSPORTATION: With global oil prices climbing higher throughout September, transportation cost inflation intensified. This marked the first time since April that global logistics prices have increased (on average).
For more information, visit www.gep.com/volatility.
Note: Full historical data dating back to January 2005 is available for subscription. Please contact economics@spglobal.com.
The next release of the GEP Global Supply Chain Volatility Index will be 8 a.m. ET, Nov. 11, 2026.
About the GEP Global Supply Chain Volatility Index
The GEP Global Supply Chain Volatility Index is produced by S&P Global and GEP. It is derived from S&P Global’s PMI® surveys, sent to companies in over 40 countries, totaling around 27,000 companies. The headline figure is a weighted sum of six sub-indices derived from PMI data, PMI Comments Trackers and PMI Commodity Price & Supply Indicators compiled by S&P Global.
- A value above 0 indicates that supply chain capacity is being stretched and supply chain volatility is increasing. The further above 0, the greater the extent to which capacity is being stretched.
- A value below 0 indicates that supply chain capacity is being underutilized, reducing supply chain volatility. The further below 0, the greater the extent to which capacity is being underutilized.
A Supply Chain Volatility Index is also published at a regional level for Europe, Asia, North America and the U.K. For more information about the methodology, click here.
About GEP
GEP® delivers AI-powered procurement and supply chain solutions that help global enterprises become more agile and resilient, operate more efficiently and effectively, gain competitive advantage, boost profitability and increase shareholder value. Fresh thinking, innovative products, unrivaled domain expertise, smart, passionate people — this is how GEP SOFTWARE™, GEP STRATEGY™ and GEP MANAGED SERVICES™ together deliver procurement and supply chain solutions of unprecedented scale, power and effectiveness. Our customers are the world’s best companies, including more than 1,000 Fortune 500 and Global 2000 industry leaders who rely on GEP to meet ambitious strategic, financial and operational goals. A leader in multiple Gartner Magic Quadrants, GEP’s cloud-native software and digital business platforms consistently win awards and recognition from industry analysts, research firms and media outlets, including Gartner, Forrester, IDC, ISG, and The Hackett Group. GEP is also regularly ranked a top procurement and supply chain consulting and strategy firm, and a leading managed services provider by ALM, Everest Group, NelsonHall, IDC, ISG and HFS, among others. Headquartered in Clark, New Jersey, GEP has offices and operations centers across Europe, Asia, Africa and the Americas. To learn more, visit www.gep.com.
Disclaimer
The intellectual property rights to the data provided herein are owned by or licensed to S&P Global and/or its affiliates. Any unauthorised use, including but not limited to copying, distributing, transmitting or otherwise of any data appearing is not permitted without S&P Global’s prior consent. S&P Global shall not have any liability, duty or obligation for or relating to the content or information (“Data”) contained herein, any errors, inaccuracies, omissions or delays in the Data, or for any actions taken in reliance thereon. In no event shall S&P Global be liable for any special, incidental, or consequential damages, arising out of the use of the Data. Purchasing Managers’ Index™ and PMI® are either trade marks or registered trade marks of S&P Global Inc or licensed to S&P Global Inc and/or its affiliates.
This Content was published by S&P Global Market Intelligence and not by S&P Global Ratings, which is a separately managed division of S&P Global. Reproduction of any information, data or material, including ratings (“Content”) in any form is prohibited except with the prior written permission of the relevant party. Such party, its affiliates and suppliers (“Content Providers”) do not guarantee the accuracy, adequacy, completeness, timeliness or availability of any Content and are not responsible for any errors or omissions (negligent or otherwise), regardless of the cause, or for the results obtained from the use of such Content. In no event shall Content Providers be liable for any damages, costs, expenses, legal fees, or losses (including lost income or lost profit and opportunity costs) in connection with any use of the Content.
Media Contacts
| Derek Creevey Director, Public Relations GEP Phone: +1 646-276-4579 Email: derek.creevey@gep.com | Joe Hayes Senior Principal Economist S&P Global Market Intelligence Phone: +44-1344-328-099 Email: joe.hayes@spglobal.com | S&P Global Market Intelligence Corporate Communications Email: Press.mi@spglobal.com |
Media contact