SAFETY STOCKPILING HITS HIGHEST LEVEL IN OVER THREE YEARS AS BUSINESSES RUSH TO PROTECT AGAINST INFLATION AND SHORTAGES: GEP GLOBAL SUPPLY CHAIN VOLATILITY INDEX
- Global supply chains remain under significant strain as manufacturers front-load purchasing to guard against anticipated higher prices in the second half of 2026
- Safety stockpiling, shortages and transportation costs have all been elevated for three straight months, a rare signal outside the 2021-2023 supply chain crisis
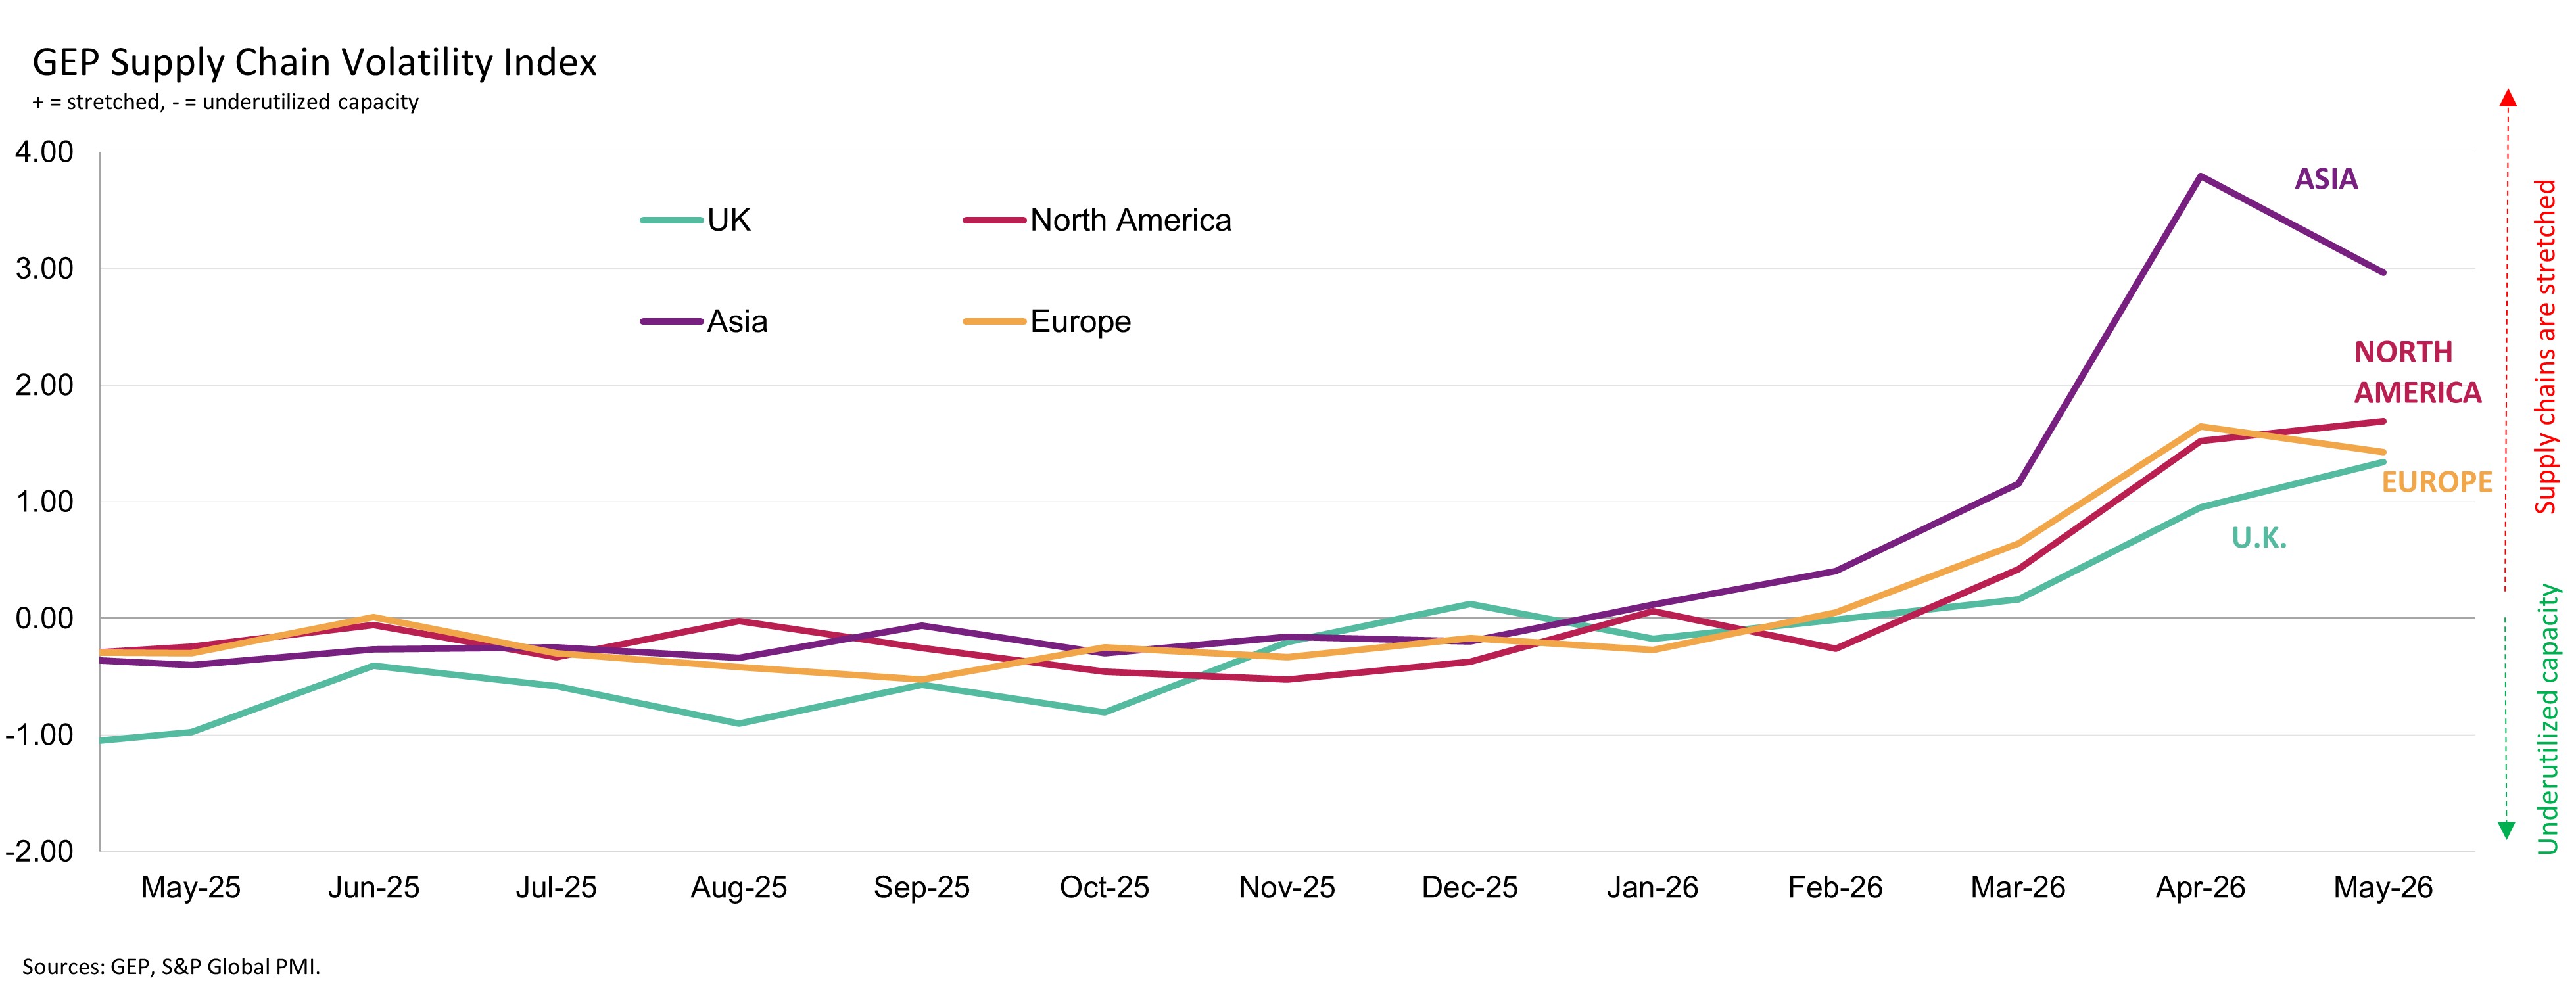
- North America supply chain pressures rise to their highest level since August 2022; Asia remains under the greatest strain globally
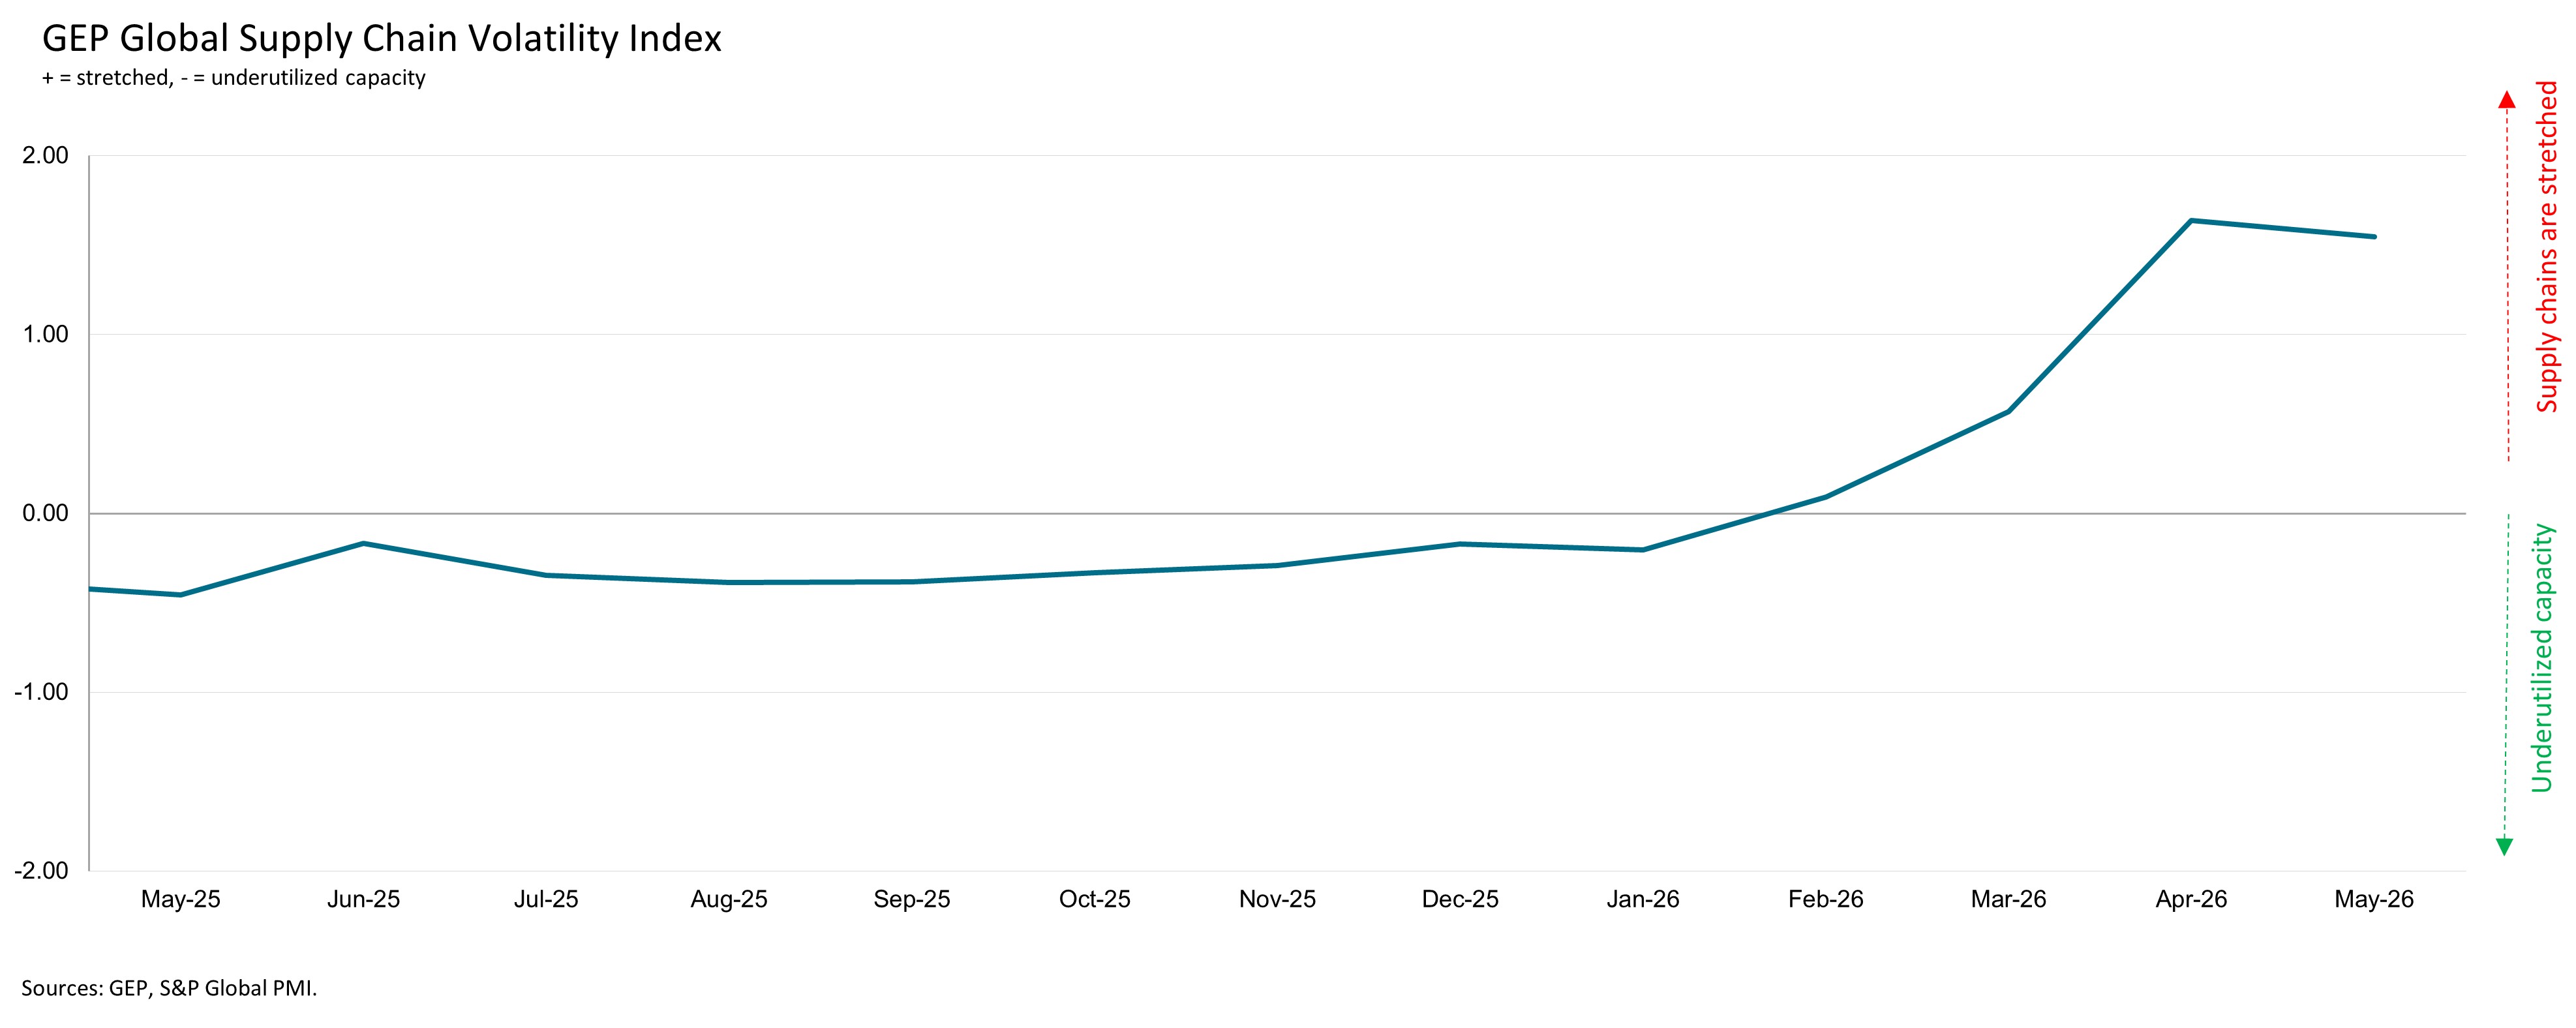
Clark, N.J., June 10, 2026 — GEP Global Supply Chain Volatility Index — based on a monthly survey of 27,000 businesses, signaled continued pressure on global supply chains in May as manufacturers increased purchases and built safety stocks to protect against rising inflation.
Reports of safety stockpiling rose to their highest level since January 2023, as companies bulk ordered goods and raw materials ahead of expected price increases and potential supply disruption. This front-loaded purchasing pushed global demand for inputs to its strongest since March 2022.
Shortages also worsened in May, reaching their highest level in three-and-a-half years. Combined with elevated transportation costs, the data shows that supply chain pressures are no longer limited to shipping and energy markets.
May’s data also points to a rare pattern: for three consecutive months, stockpiling, shortages and transportation costs have all been elevated. Outside the 2021-2023 supply chain crisis, this has typically been followed by a sharp fall in the index as supply chains self-correct (see chart below), often through weaker input demand or deteriorating economic conditions.
“The path for inflation is already being set, and companies are trying to limit the damage,” said John Piatek, vice president, consulting, GEP. “The surge in purchasing we saw in April and May is likely temporary. Once companies have built inventory, they and their customers will pull back, which means supply chain pressures may ease. But, even if the Strait of Hormuz is opened fully, economic conditions will likely weaken in the second half of the year as companies will pull back on their input purchasing to draw down the inventories they’ve built up.”
Interpreting the data:
Index > 0, supply chain capacity is being stretched. The further above 0, the more stretched supply chains are.
Index < 0, supply chain capacity is being underutilized. The further below 0, the more underutilized supply chains are.
MAY 2026 REGIONAL KEY FINDINGS
- ASIA: Index fell from 3.79 to 2.96, signaling a slight easing of pressures versus April. Nonetheless, the index was indicative of significant supply chain stress for Asian manufacturers.
- NORTH AMERICA: Index rose to 1.69, from 1.52, its highest level since August 2022. Stronger purchasing activity, particularly in the U.S., and greater stockpiling, drove the rise in supplier capacity pressures.
- EUROPE: Index fell to 1.43, from 1.64, as factory purchasing volumes across the continent were tapered. This reflected fresh signs of weakness in the German and French manufacturing economies.
- U.K.: Index rises to three-and-a-half year high of 1.34, up from 0.96 in April, pointing to greater capacity constraints for suppliers used by U.K. manufacturers.
MAY 2026 KEY FINDINGS
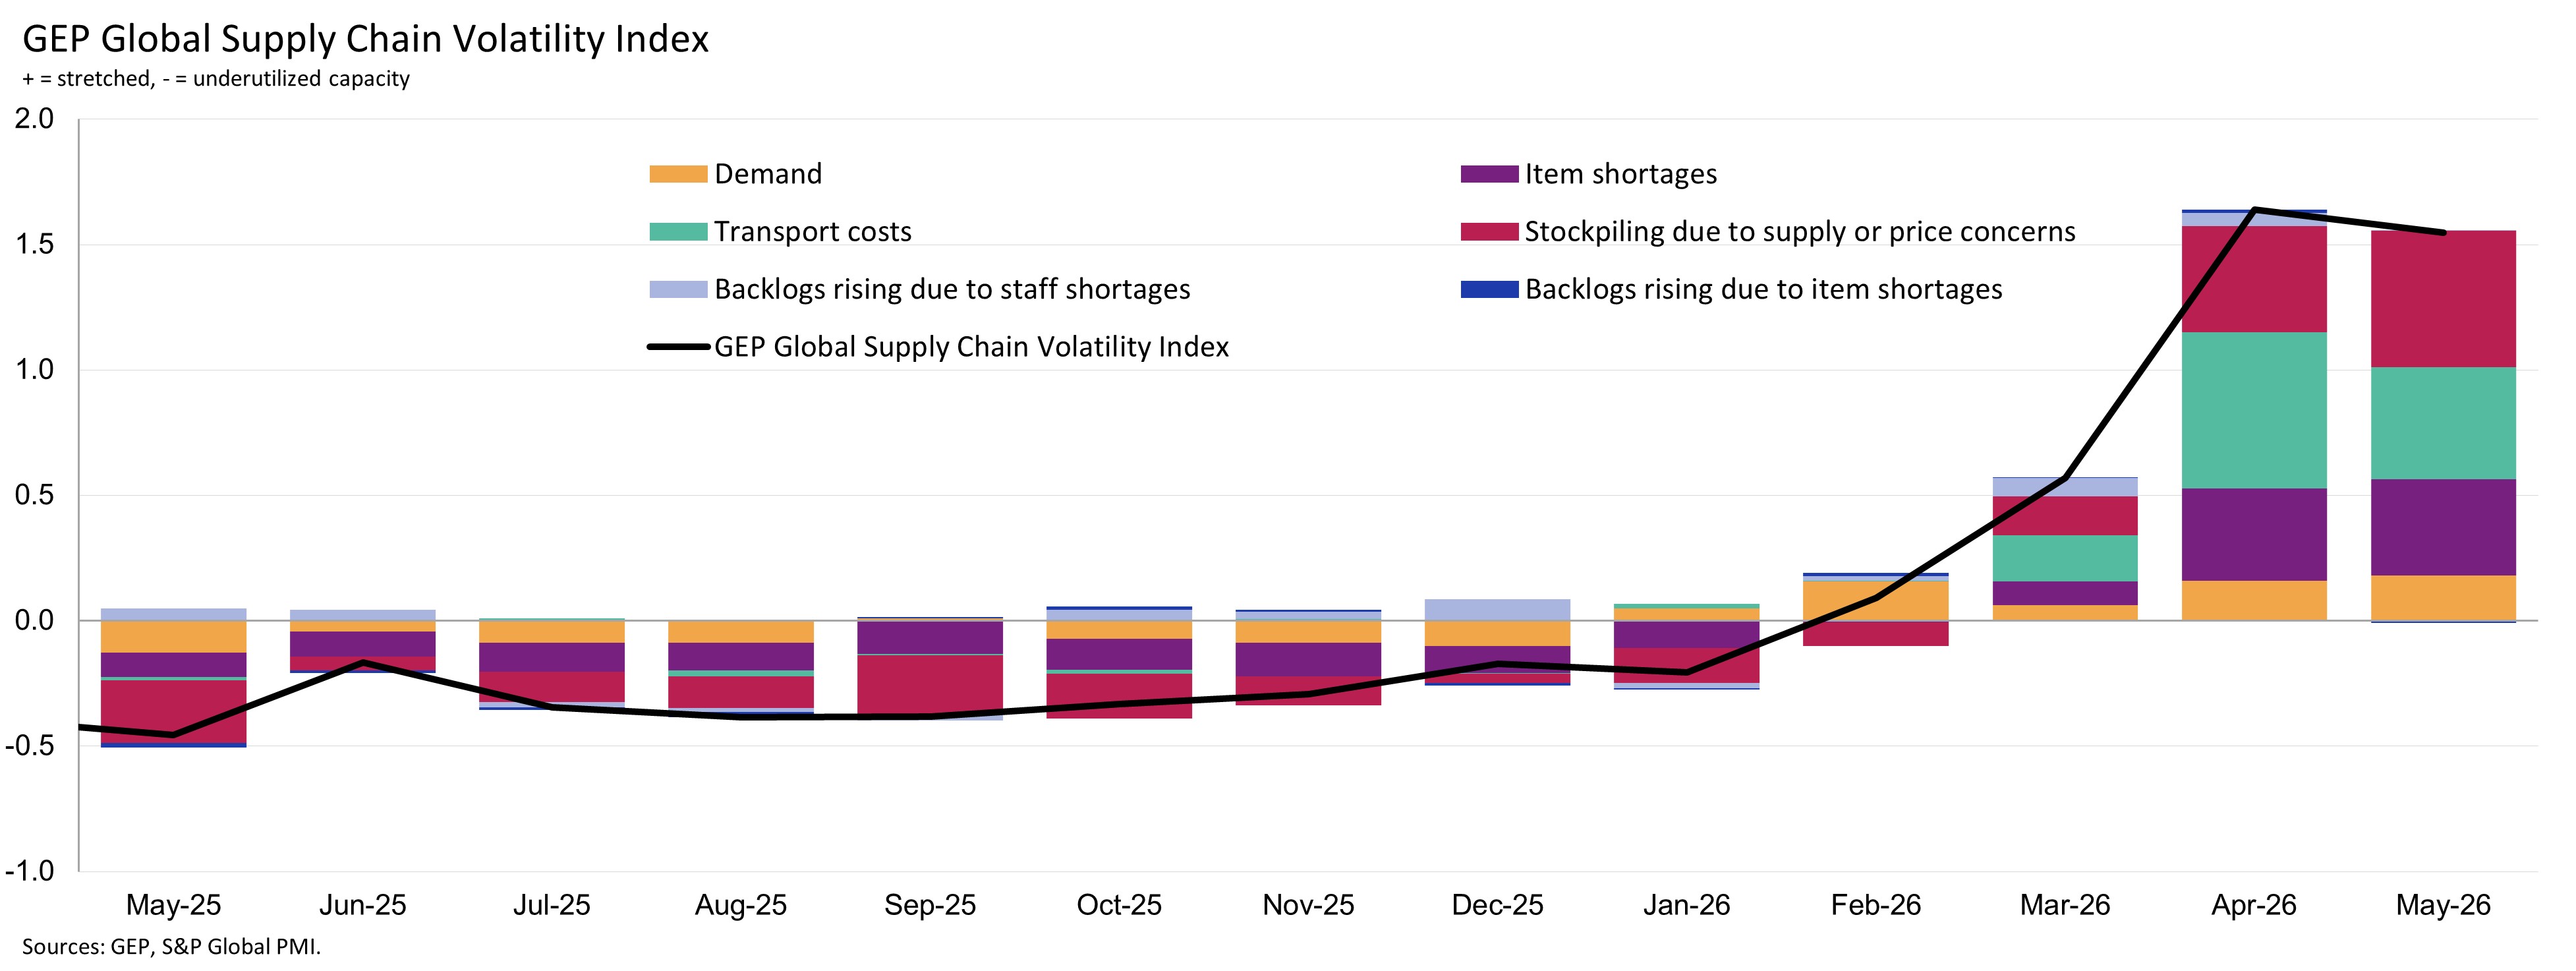
- DEMAND: Global demand for raw materials, commodities and intermediate goods required by manufacturers continued to strengthen in May, seeing its strongest rise since March 2022. Growth accelerated across North America, driven by the U.S., and also Asia. Factories in Japan, India, South Korea and Taiwan reported more aggressive purchasing activity in May. Meanwhile, reduced procurement in Germany and France caused a European slowdown.
- INVENTORIES:Reports of inventories rising due to price or supply concerns rose further, marking a sustained increase since the war in the Middle East and effective closure of the Strait of Hormuz commenced. Safety stockpiling was at its most prevalent since January 2023, with manufacturers in Asia, Europe and North America building warehouse buffers more aggressively in May.
- MATERIAL SHORTAGES: The items in short supply indicator ticked up in May, signaling that worldwide shortages worsened from April and were the highest in three-and-a-half years. The combination of low supply and stockpile-driven demand is exerting significant upward pressure on factory gate prices.
- LABOR SHORTAGES: Manufacturing workforces are not inhibiting capacity, as reports of backlogs rising due to labor shortages were aligned with historically average levels.
- TRANSPORTATION:After soaring to a record high in April (since 2005 when data were first available), transportation cost pressures eased slightly in May, as global oil prices stepped down from the peaks seen since the war in the Middle East began. Nevertheless, they remained the second-strongest since March 2022, following Russia’s full-scale invasion of Ukraine.
For more information, visit the www.gep.com/volatility.
Note: Full historical data dating back to January 2005 is available for subscription. Please contact economics@spglobal.com.
The next release of the GEP Global Supply Chain Volatility Index will be 8 a.m. ET, July 13, 2026.
About the GEP Global Supply Chain Volatility Index
The GEP Global Supply Chain Volatility Index is produced by S&P Global and GEP. It is derived from S&P Global’s PMI® surveys, sent to companies in over 40 countries, totaling around 27,000 companies. The headline figure is a weighted sum of six sub-indices derived from PMI data, PMI Comments Trackers and PMI Commodity Price & Supply Indicators compiled by S&P Global.
- A value above 0 indicates that supply chain capacity is being stretched and supply chain volatility is increasing. The further above 0, the greater the extent to which capacity is being stretched.
- A value below 0 indicates that supply chain capacity is being underutilized, reducing supply chain volatility. The further below 0, the greater the extent to which capacity is being underutilized.
A Supply Chain Volatility Index is also published at a regional level for Europe, Asia, North America and the U.K. For more information about the methodology, click here.
About GEP
GEP® delivers AI-powered procurement and supply chain solutions that help global enterprises become more agile and resilient, operate more efficiently and effectively, gain competitive advantage, boost profitability and increase shareholder value. Fresh thinking, innovative products, unrivaled domain expertise, smart, passionate people — this is how GEP SOFTWARE™, GEP STRATEGY™ and GEP MANAGED SERVICES™ together deliver procurement and supply chain solutions of unprecedented scale, power and effectiveness. Our customers are the world’s best companies, including more than 1,000 Fortune 500 and Global 2000 industry leaders who rely on GEP to meet ambitious strategic, financial and operational goals. A leader in multiple Gartner Magic Quadrants, GEP’s cloud-native software and digital business platforms consistently win awards and recognition from industry analysts, research firms and media outlets, including Gartner, Forrester, IDC, ISG, and Spend Matters. GEP is also regularly ranked a top procurement and supply chain consulting and strategy firm, and a leading managed services provider by ALM, Everest Group, NelsonHall, IDC, ISG and HFS, among others. Headquartered in Clark, New Jersey, GEP has offices and operations centers across Europe, Asia, Africa and the Americas. To learn more, visit www.gep.com.
Disclaimer
The intellectual property rights to the data provided herein are owned by or licensed to S&P Global and/or its affiliates. Any unauthorised use, including but not limited to copying, distributing, transmitting or otherwise of any data appearing is not permitted without S&P Global’s prior consent. S&P Global shall not have any liability, duty or obligation for or relating to the content or information (“Data”) contained herein, any errors, inaccuracies, omissions or delays in the Data, or for any actions taken in reliance thereon. In no event shall S&P Global be liable for any special, incidental, or consequential damages, arising out of the use of the Data. Purchasing Managers’ Index™ and PMI® are either trade marks or registered trade marks of S&P Global Inc or licensed to S&P Global Inc and/or its affiliates.
This Content was published by S&P Global Market Intelligence and not by S&P Global Ratings, which is a separately managed division of S&P Global. Reproduction of any information, data or material, including ratings (“Content”) in any form is prohibited except with the prior written permission of the relevant party. Such party, its affiliates and suppliers (“Content Providers”) do not guarantee the accuracy, adequacy, completeness, timeliness or availability of any Content and are not responsible for any errors or omissions (negligent or otherwise), regardless of the cause, or for the results obtained from the use of such Content. In no event shall Content Providers be liable for any damages, costs, expenses, legal fees, or losses (including lost income or lost profit and opportunity costs) in connection with any use of the Content.
Media Contacts
| Derek Creevey Director, Public Relations GEP Phone: +1 732-382-6565 Email: derek.creevey@gep.com | Joe Hayes Principal Economist S&P Global Market Intelligence Phone: +44-1344-328-099 Email: joe.hayes@spglobal.com | S&P Global Market Intelligence Email: Press.mi@spglobal.com |
Media contact