
Rising input costs and a hypercompetitive global market can deliver a one-two punch to corporate profitability. Intense competition leaves little or no room to raise prices of goods and services at par with higher input costs. An effective — yet challenging — strategy to achieve a better top and bottom line is to control costs.
How can enterprises embark on a high-impact cost reduction journey underpinned by consistent and end-to-end visibility into all input costs?
An insightful paper from GEP — Cost Breakdown Analysis: The Final Frontier in Cost Cutting — discusses a highly effective technique that drives input cost visibility, helping procurement leaders evaluate competitiveness of current prices and the economic impact of executive decisions. The paper also cites specific examples to underline the utility and effectiveness of this methodology.
What’s Inside:
- A step-by-step approach to cost breakdown analysis
- Strategic benefits of the methodology
- Key insights from procurement case studies
Read today to understand how procurement can make a direct, bottom-line impact on the enterprise.
Introduction
The combination of rising input costs and increasing global competition can act like a one-two punch to corporate profits. Intense global competition leaves little or no room to raise prices of goods and services at par with higher input costs. The only way forward to achieve a better top and bottom line is to reduce or control costs. Before embarking on a high-impact cost reduction program, enterprises have to find a way to drive consistent and end-to-end visibility into all input costs.
Input cost visibility can be obtained using a technique called cost breakdown analysis. This is a process for building and understanding the elements that constitute the cost of a product or service procured. For an organization’s senior management, cost breakdown analysis is an effective technique that helps evaluate competitiveness of current prices and the economic impact of executive decisions.
Definition: Cost breakdown analysis is the process of building and understanding the elements that constitute the cost of a product or service. This technique is also referred to as clean sheet costing, open book costing, should cost analysis, teardown analysis, price breakdown analysis or supplier cost analysis.
The Approach to Cost Breakdown Analysis (CBA)
Though many supplier relationships are moving toward strategic supply alliances, traditional arm’s-length relationships still exist. In such a situation, the purchaser must discover the main drivers of the supplier’s costs to demand competitive pricing. Even within a strategic supply alliance, in which both companies jointly study costs and cost drivers to reduce material costs, it is necessary for the purchaser to be aware of supplier’s costs.
Cost Breakdown Analysis Is a Four-Step Approach
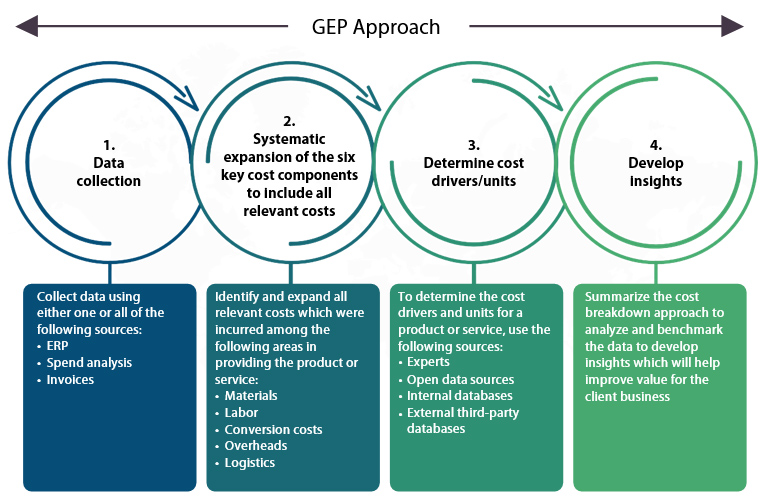
1. Data Collection:
The product or service data to be analyzed under the CBA framework is identified by obtaining information through the following data sources:
- Enterprise resource platform (ERP)
- Procurement systems
- Supplier invoices
- Spend analysis summaries
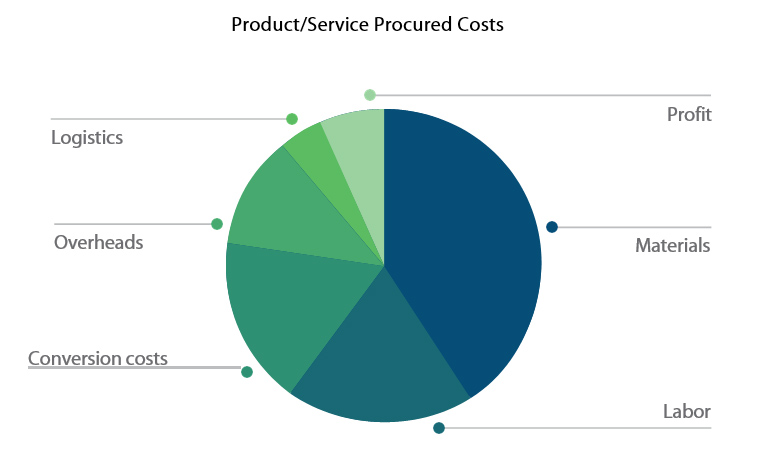
2. Systematic Expansion of the Six Key Cost Components:
Once the service or product to be analyzed is identified, it is important to expand all components comprising the following six key cost elements.
3. Determine Drivers of Cost/Unit:
The drivers can be determined by identifying all cost/process factors, in addition to the derived costs to manufacture the product or provide the service.
- Materials:
The bills of materials or design and production specification documents provide a list (and quantity) of materials consumed in the product. The relevant information can be obtained through:
- ERP/MRP systems
- Research of open market sources
- Internal consultant databases
- Interviews with experts/primary research
- Professional associations
If you cannot obtain these documents, you may have to reverse-engineer the product. This means that you disassemble the product to determine the cost of its materials. In case of liquid products, you can use gas chromatography to separate all chemicals used in the final mix.
The price of the materials can be obtained using sources such as:
- Market situations and price trends for products in consideration
- Prevailing and historic commodity market prices
- Estimation for the product/raw materials in question
- Internal benchmarks
- Labor:
To estimate the cost of labor, you need to know the number of workers used in the manufacturing process, the hours worked on the process and the average wage rate.To determine the above factors, it is important to identify the following labor-specific characteristics:
- Technology employed by the manufacturing process
- Level of process automation
- Skill requirement and eligibility for the personnel to produce a product such as education, expertise, training, etc.
To obtain accurate estimates of the total annual labor, costs can be multiplied with adjustment factors such as vacation and supervision. All information required to accurately compute the cost of labor can be obtained from the following sources:
- Independent primary research
- Professional associations
- Experts
- Secondary research
- Supplier visits
- Conversion Costs:
Conversion costs include all the activities associated with the physical process of conversion of raw materials into finished goods. The costs include manufacturing process and cycle time costs, utilities, depreciation, maintenance and all other ancillary activities related to manufacturing the product.
Manufacturing process costs refer to costs of activities like machining (e.g. turning, drilling), finishing (e.g. honing, milling), preparation (e.g. heating, mixing) and processing (e.g. printing, cutting).
It is important to identify the appropriate drivers and units that form the key components of the conversion process. For example, using $/M Sq. Ft or $/M pieces as units for cost drivers could lead to very different results while performing price sensitivity analysis.
To effectively analyze conversion costs, it’s important to develop detailed process maps of all activities involved in manufacturing a product. It’s also key to develop an understanding of all additional costs incurred during the manufacturing process, such as time taken to complete a process, throughput, cost of machinery, setup costs, machine maintenance costs and associated depreciation rates. All the above can be confirmed by soliciting expert opinions in consultation with the supplier.
- Overheads:
Typical overheads include all non-operating expenses incurred in the manufacture of a product. It can include expenses such as:
- Plant overheads
- Selling expenses
- Executive compensation
- Design and development expenses
- Administrative expenses
- Rent, leases, etc.
Plant overheads include all the indirect costs associated with the production of a product or service. This term encompasses many different elements, depending on the company and the industrial sector. Generally, items include:
- General plant burdens
- Overtime
- Plant administration
As no formal method exists for allocating such expenses, overheads can be estimated as a percentage of the labor costs incurred to manufacture a product.
It’s difficult to attribute the exact overhead expenditure incurred for manufacturing a product. A common approach is to estimate the expected expenditure as a percentage of revenues. If the supplier’s financial statements are available, it’s reasonable to assume that overhead expenditure on the products sold is in the same proportion as that of the overall corporate entity. If financial statements are not available, then a reasonable estimate can be made by assuming that incurred expenditure is similar to the industry average.
- Logistics:
Logistics comprise the following costs:
- Custom clearance
- Transportation
- Warehousing
- Distribution
Each of these cost elements can be influenced by specific factors. For example, custom clearance is dependent on the importing country’s prescribed rules and regulations.
Transportation and distribution costs incurred are dependent on:
- The distance traveled in moving goods from the production center to the consumption center
- The mode of transportation, such as inland water transportation, ocean water transportation, air, train or road
- Warehousing cost is dependent on volume of goods stored, type of goods stored and the length of time for which the goods were stored
- Finally, all of the above are also affected by the nature of goods procured and the frequency of procurement
- Supplier Margins:
The last cost driver is supplier margins, as even suppliers must earn a profit commensurate with the market conditions and industry structure. Any adjustment to supplier margins in relation to observed industry averages can be made by taking the existing relationship into account, willingness to do business, and product/service differentiation.
4. Strategic Benefits From the Approach:
The overarching aim of the analysis is to answer the following questions:
How do we proactively control costs and derive competitive advantage through our procurement practices?
Since the CBA exercise is done largely based on industry-level averages and estimates, the results can be used to measure competitiveness of our procurement costs with respect to industry peers. Comparative analysis across suppliers, SKUs and geographies helps us craft informed negotiation strategies to lower purchase prices and minimize overall procurement costs. The increased visibility that the technique provides assists in controlling costs on an ongoing basis.
Are we buying the right products and services?
Many organizations understand very little about what they buy. The impact that this has on the organization’s product quality and cost competitiveness can be immense, depending on the criticality of the product/service being procured. Cost breakdown analysis is a good way to increase the understanding of what is being procured, and its impact on the business. The process gives a greater insight into the manufacturing process, and an understanding of all inputs needed to convert raw materials into the final procured product.
This can help clarify current specifications and service levels, and reduce excesses and inefficiencies.
How does our supplier alliance impact competitiveness?
In this age of integrated supply chain and co-located vendors, suppliers and customers are highly interdependent. Procurement is not just about reducing costs; it’s also about aligning your supplier to become your partner in success.
CBA is very useful in the supplier development process. The knowledge obtained through this exercise helps organizations understand strengths and weaknesses of their suppliers. It also helps evaluate existing and potential suppliers on the basis of their operational capabilities (technology, level of automation, etc.) and their fit with the organization’s requirements. Additionally, CBA aids development of a long-term supplier strategy for the category (e.g., competitive sourcing vs. collaborative vendor development).
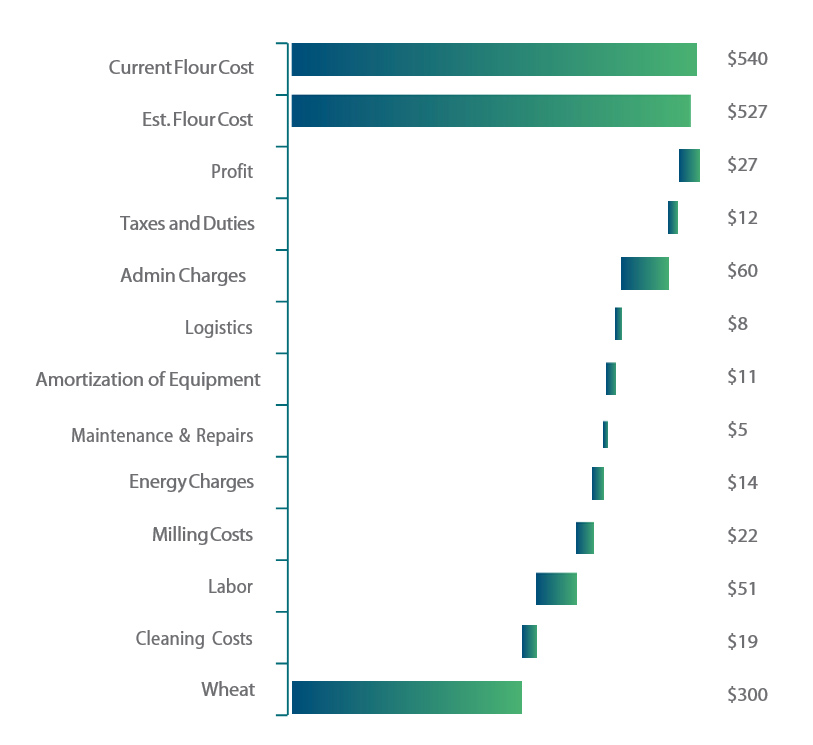
Case Study: 1
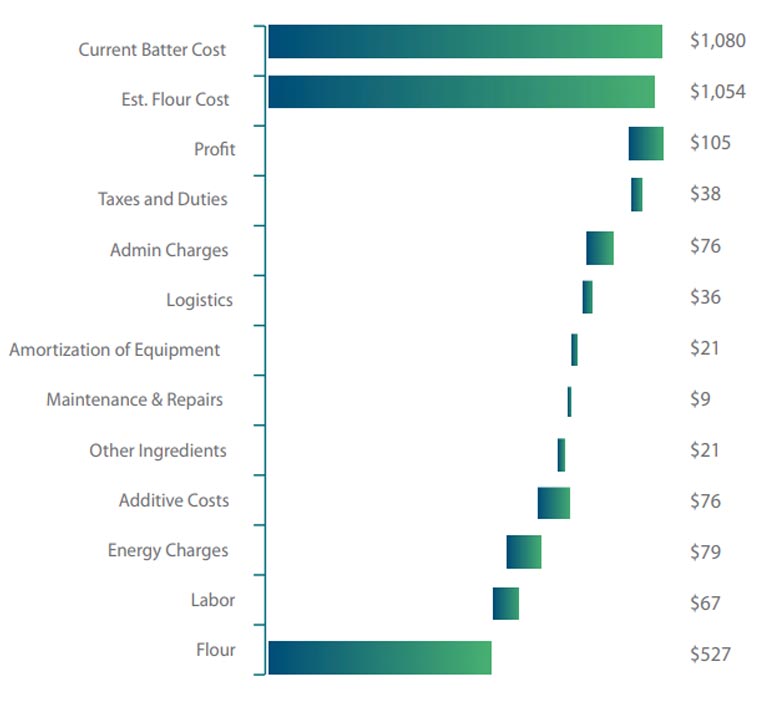
During a performance benchmarking exercise for a leading international food processing company, consultants used the cost breakdown analysis methodology to systematically reverse- engineer all costs incurred in the procurement of flour (intermediate product), in addition to batter (final product).
Part 1: Cost Breakdown Analysis of Flour (Ingredients for Batter)
Part 2: Cost Breakdown Analysis of Batter
Insights:
The analysis revealed the following:
- Current batter prices were at least 5 percent higher than estimated costs
- A savings opportunity existed with flour, as well as batter conversion costs
- There was no visibility into wheat costs and the cost of additives as the recipes were confidential and shared by end customers directly with the batter supplier
Result:
Based on the analysis, we were able to realize a 6 percent reduction in batter prices, using the following approaches:
- Standardize some batter recipes to increase economies in conversion
- Negotiate more effectively with the supplier to bring down costs in specific areas
- Conduct negotiations on behalf of the batter manufacturer to reduce procurement costs of the purchase of flour
- Work with end customers to implement a variable cost model that would compute wheat and additive costs based on hidden recipe formulas, thereby increasing visibility of costs without breaching confidentiality
- Index the price of wheat to the market
- Introduce a price list mechanism for additives, reviewed quarterly
- Work with the supplier to separate packaging transportation and storage from conversion cost
Case Study: 2
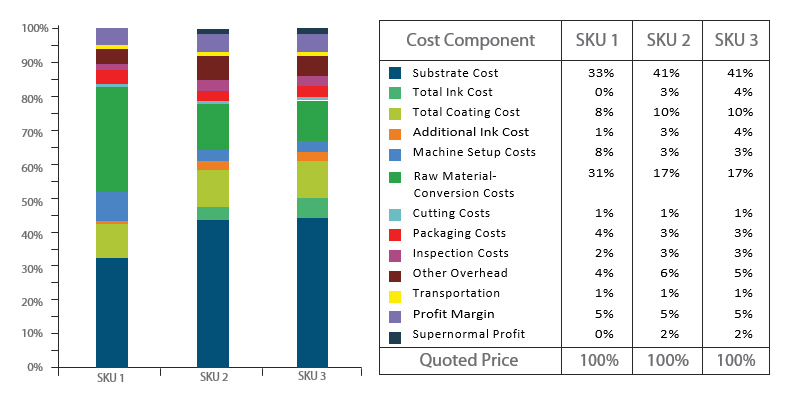
While executing a spend analysis project for a leading beverage manufacturer, consultants noticed a high level of spend across three high-value SKU categories. Using the cost breakdown analytical framework, we observed the following cost structures:
Cost Breakdown Analysis of Three SKUs
Insight:
The cost breakdown variance between different SKUs indicated that the design specifications had a significant impact on the end-product price, resulting in the need to increase price visibility at an SKU level. Also, comparative analysis of each of the suppliers across the three SKU categories identified significant opportunities to improve processes and to reduce margins through systematic negotiations.
Result:
To determine an appropriate pricing for the SKUs, a Request for Pricing with a variable price model was developed to capture each detailed cost component. Using the information collected, the most competitive prices across suppliers were applied to each component to develop best case price. The process not only provided more visibility into the individual cost components, but also developed an informed negotiation strategy to realize 13 percent savings in procured costs.
Conclusion
Unlike traditional product costing methods that are rigid and far too narrow in their scope, cost breakdown analysis provides a more holistic view — accounting for the supply market, industry trends and the competitor landscape. By driving comparative cost analysis across wide-ranging factors, cost breakdown analysis allows enterprises to develop effective supplier negotiation strategies to source materials at competitive prices.
Understandably, an approach as comprehensive as cost breakdown analysis is not easy to implement. However, if done the right way, it can act as a strategic lever for any enterprise, mitigating supply chain risks, enabling buyer-supplier collaboration and boosting profitability.