Excess Capacity in World’s Supply Chains Up Sharply in July and at the Fastest Pace Since May 2020, Pointing to Deteriorating Economic Conditions: GEP Global Supply Chain Volatility Index
- Demand conditions, which remain very depressed globally, declined at even sharper rates in Europe and the U.K. in July; contrasting with shallower demand downturn in North America, highlighting some divergence in global economies
- European supply chain spare capacity was at its greatest level since the global financial crisis of 2008-2009
- Global transport costs fall to their lowest level since 2016, showing that the period of runaway inflation in freight is over
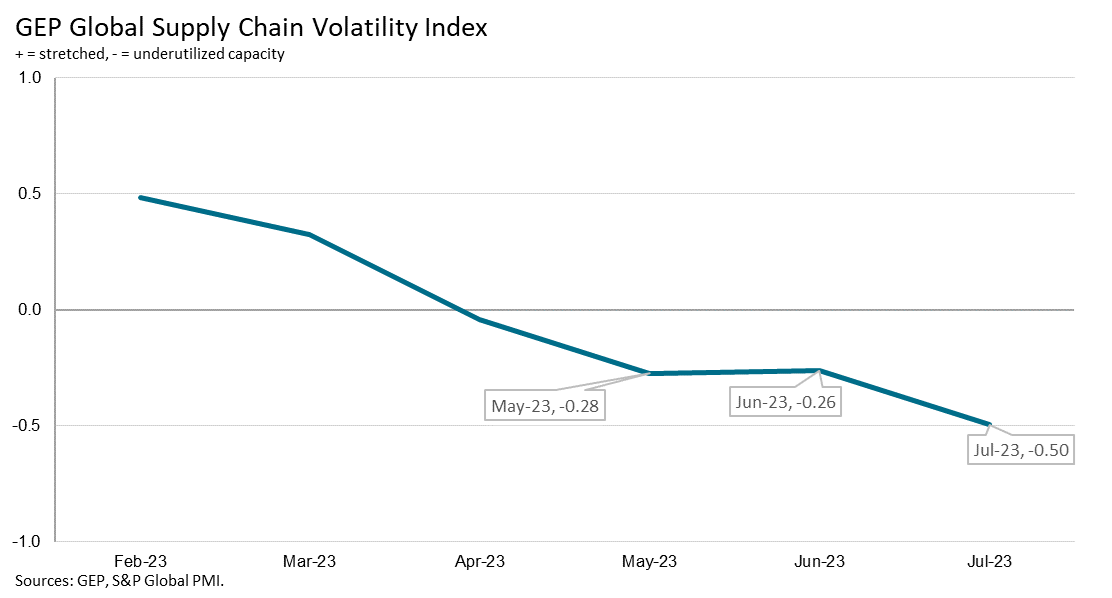
Clark, N.J., Aug. 14, 2023 – The GEP Global Supply Chain Volatility Index — a leading indicator tracking demand conditions, shortages, transportation costs, inventories and backlogs based on a monthly survey of 27,000 businesses — fell to -0.50 in July, from -0.26 in June, indicating a further and accelerated rise in excess capacity across global supply chains amid weak global demand conditions and sustained destocking of warehouses.
In fact, global supplier spare capacity was nearly on par with its zenith during the pandemic in May 2020, rising for a fourth month in succession and indicating a considerable weakening of global economic conditions.
July data signalled a weak start to the second half of 2022 for the global economy, with demand for commodities, components and raw materials remaining depressed. Demand weakened in Europe especially as conditions in major markets such as the United Kingdom, Germany and France worsened. In fact, excess capacity at European suppliers reached its highest level since the global financial crisis of 2008-2009. In contrast, demand in North America fell to a weaker extent than in June, tentatively pointing to some divergence in the trajectory of the economies on either side of the Atlantic.
Commenting on the July data, Jonathan Kinghan, vice president, supply chain consulting, GEP, said: “We’re now in the 14th consecutive month of subdued demand across Europe, and our July data shows it’s getting significantly worse across the continent, in contrast to North America. Our data does not indicate a ‘soft landing’ in Europe. As a result, companies have greater leverage to negotiate favourable terms from suppliers for 2024 and 2025.”
Interpretating the data:
- Index > 0, supply chain capacity is being stretched. The further above 0, the more stretched supply chains are.
- Index < 0, supply chain capacity is being underutilized. The further below 0, the more underutilized supply chains are.
July 2023 Key Findings:
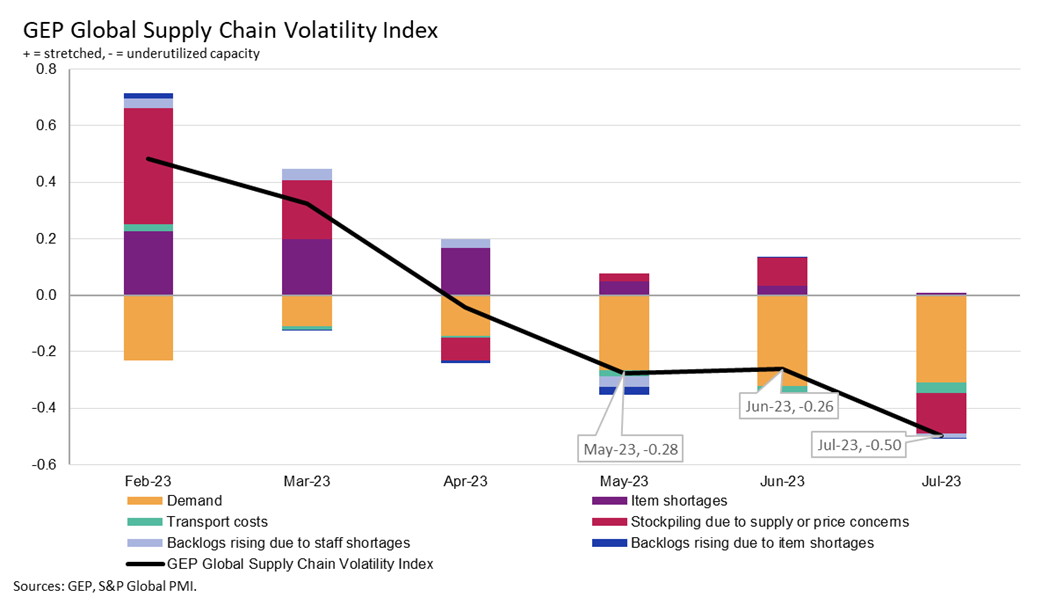
- DEMAND: Global demand for commodities, components and raw materials continues to weaken at the strongest pace since the start of the year. Europe is seeing the steepest downturn in demand by a notable margin, while purchasing activity in Asia fell slightly in July. North American demand conditions were less depressed than in June, hinting at potential divergences opening between major markets.
- INVENTORIES: Reports from businesses of safety stockpiling fell below the long-run average in July as a result of sustained efforts by companies to destock. However, in North America, stockpiling ticked up slightly in July, despite months of subdued demand.
- MATERIALS SHORTAGES: Supply shortages have ended, with reports of item scarcity now in line with historically normal levels.
- LABOR SHORTAGES: Despite historically low unemployment in economies such as U.S., reports of backlogs directly due to a lack of employees are historically low.
- TRANSPORTATION: Global transportation costs fell further to the lowest level since January 2016.
REGIONAL SUPPLY CHAIN VOLATILITY
- NORTH AMERICA: Index rose to -0.37 from -0.85, indicating slower rise in excess capacity.
- EUROPE: Index down to its lowest level since the 2008-2009 global financial crisis at -1.07, from -0.67 in June, indicating marked worsening of economic conditions in Europe.
- U.K.: Index fell to -1.01, from -0.66 as weakness in major trading partners in Europe spills over, driving a sharper rise in supplier spare capacity.
- ASIA: While the index fell to a three-year low of -0.31, from -0.17 in July, the region still shows more resilience than the rest of the world.
For more information, visit www.gep.com/volatility
Note: Full historic data dating back to January 2005 is available for subscription. Please contact economics@spglobal.com.
The next release of the GEP Global Supply Chain Volatility Index will be 8 a.m. ET, September 15, 2023.
ABOUT THE GEP GLOBAL SUPPLY CHAIN VOLATILITY INDEX
The GEP Global Supply Chain Volatility Index is produced by S&P Global and GEP. It is derived from S&P Global’s PMI™ surveys, sent to companies in over 40 countries, totaling around 27,000 companies. The headline figure is a weighted sum of six sub-indices derived from PMI data, PMI Comments Trackers and PMI Commodity Price & Supply Indicators compiled by S&P Global.
- A value above 0 indicates that supply chain capacity is being stretched and supply chain volatility is increasing. The further above 0, the greater the extent to which capacity is being stretched.
- A value below 0 indicates that supply chain capacity is being underutilized, reducing supply chain volatility. The further below 0, the greater the extent to which capacity is being underutilized.
A Supply Chain Volatility Index is also published at a regional level for Europe, Asia, North America and the U.K. For more information about the methodology, click here.
About GEP
GEP® delivers transformative supply chain solutions that help global enterprises become more agile and resilient, operate more efficiently and effectively, gain competitive advantage, boost profitability and increase shareholder value. Fresh thinking, innovative products, unrivaled domain expertise, smart, passionate people — this is how GEP SOFTWARE™, GEP STRATEGY™ and GEP MANAGED SERVICES™ together deliver supply chain solutions of unprecedented scale, power and effectiveness. Our customers are the world’s best companies, including more than 550 Fortune 500 and Global 2000 industry leaders who rely on GEP to meet ambitious strategic, financial and operational goals. A leader in multiple Gartner Magic Quadrants, GEP’s cloud-native software and digital business platforms consistently win awards and recognition from industry analysts, research firms and media outlets, including Gartner, Forrester, IDC, ISG, and Spend Matters. GEP is also regularly ranked a top supply chain consulting and strategy firm, and a leading managed services provider by ALM, Everest Group, NelsonHall, IDC, ISG and HFS, among others. Headquartered in Clark, New Jersey, GEP has offices and operations centers across Europe, Asia, Africa and the Americas. To learn more, visit www.gep.com.
About S&P Global
S&P Global (NYSE: SPGI) S&P Global provides essential intelligence. We enable governments, businesses and individuals with the right data, expertise and connected technology so that they can make decisions with conviction. From helping our customers assess new investments to guiding them through ESG and energy transition across supply chains, we unlock new opportunities, solve challenges and accelerate progress for the world. We are widely sought after by many of the world’s leading organizations to provide credit ratings, benchmarks, analytics and workflow solutions in the global capital, commodity and automotive markets. With every one of our offerings, we help the world’s leading organizations plan for tomorrow, today.
Media Contacts
| Derek Creevey Director, Public Relations GEP Phone: +1 732-382-6565 Email: derek.creevey@gep.com |
Joe Hayes Principal Economist S&P Global Market Intelligence T: +44-1344-328-099 Email: joe.hayes@spglobal.com |
Disclaimer
The intellectual property rights to the data provided herein are owned by or licensed to S&P Global and/or its affiliates. Any unauthorised use, including but not limited to copying, distributing, transmitting or otherwise of any data appearing is not permitted without S&P Global’s prior consent. S&P Global shall not have any liability, duty or obligation for or relating to the content or information (“data”) contained herein, any errors, inaccuracies, omissions or delays in the data, or for any actions taken in reliance thereon. In no event shall S&P Global be liable for any special, incidental, or consequential damages, arising out of the use of the data. Purchasing Managers’ Index™ and PMI™ are either registered trademarks of Markit Economics Limited or licensed to Markit Economics Limited and/or its affiliates.
This Content was published by S&P Global Market Intelligence and not by S&P Global Ratings, which is a separately managed division of S&P Global. Reproduction of any information, data or material, including ratings (“Content”) in any form is prohibited except with the prior written permission of the relevant party. Such party, its affiliates and suppliers (“Content Providers”) do not guarantee the accuracy, adequacy, completeness, timeliness or availability of any Content and are not responsible for any errors or omissions (negligent or otherwise), regardless of the cause, or for the results obtained from the use of such Content. In no event shall Content Providers be liable for any damages, costs, expenses, legal fees, or losses (including lost income or lost profit and opportunity costs) in connection with any use of the Content.
Media contact