Odds of a Soft Landing for the U.S. Economy Are Rising as Manufacturing Stabilizes in September, but Recession Alarm Bells Ring for Europe: GEP Global Supply Chain Volatility Index
- The downturn in global demand for commodities and raw materials is stabilizing, but we’re yet to see any signs of improvement
- Europe is by far the globe’s biggest weak spot, as plummeting demand in major economies such as Germany and France raises recession risks
- By contrast, excess capacity across North American supply chains increases by the smallest margin since April, hinting at soft landing
- Asian suppliers report an uplift in spare capacity due to deteriorating economic conditions after a relatively resilient year-to-date
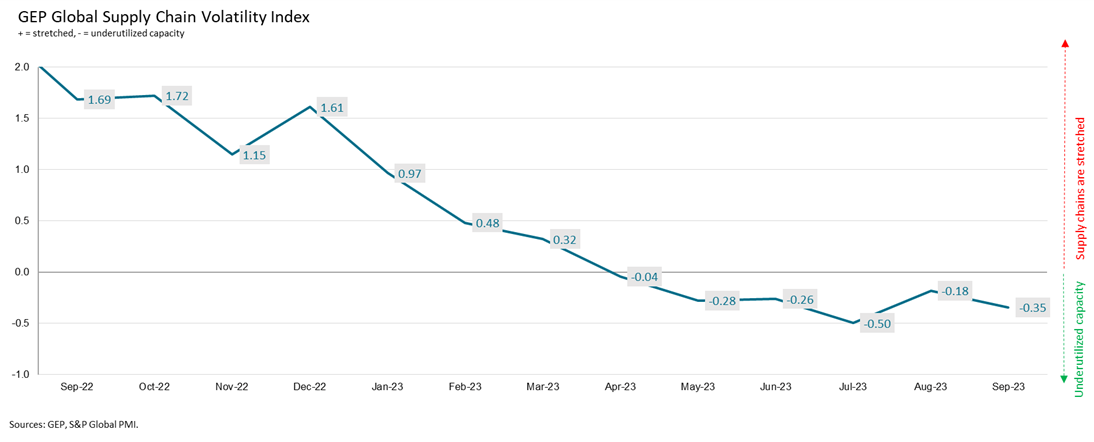
Clark, N.J., Oct. 13, 2023 – The GEP Global Supply Chain Volatility Index — a leading indicator tracking demand conditions, shortages, transportation costs, inventories and backlogs based on a monthly survey of 27,000 businesses — fell from -0.18 in August to -0.35 in September, with a sharper increase in excess capacity across the world’s supply chains.
Notably, Europe was the principal driver of September’s sharper rise in idle vendor capacity, with suppliers to the continent registering one of the highest levels of spare capacity since the global financial crisis between 2008 and 2009 amid considerable weakness in demand, thereby signalling elevated recession risks.
In stark contrast, excess supplier capacity within North America rose by its smallest margin since April, signalling increased odds of a soft landing for the U.S. economy. Although demand remains under pressure, the decline is slowing, and some companies are reporting price increases from their vendors.
Asian suppliers, after displaying relatively greater resilience in the year-to-date, reported greater spare capacity for the first time since July, reflecting a slump in purchasing activity. This suggests manufacturers in the region are preparing for lower production schedules.
Commenting on the September data, Jagadish Turimella, chief operating officer and co-founder, GEP, explained: “We’re now into our sixth consecutive month of notable excess supplier capacity globally, but the good news is it’s not getting substantially worse, except in Europe, where recession seems likely. By contrast, we expect U.S. suppliers and businesses to be steady for the rest of the year, unless the labor disputes in health care and the auto sector spread, or there is a price spike in oil, its derivates or agricultural commodities.”
Interpretating the data:
- Index > 0, supply chain capacity is being stretched. The further above 0, the more stretched supply chains are.
- Index < 0, supply chain capacity is being underutilized. The further below 0, the more underutilized supply chains are.
SEPTEMBER 2023 KEY FINDINGS :
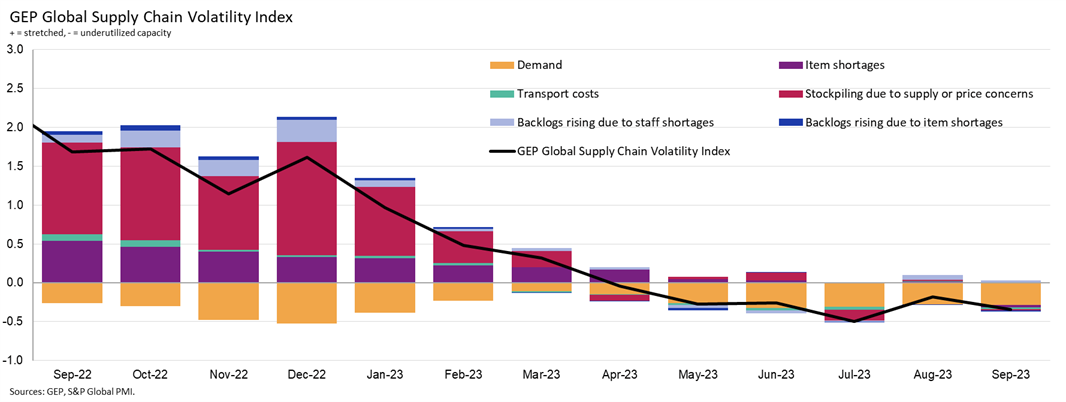
- DEMAND: While the downturn in demand for raw materials, commodities and components appears to be stabilizing, the pace of decline is showing no real signs of slowing as purchasing activity fell again at a similar rate to those seen in the summer months.
- INVENTORIES: Global businesses continue to shy away from stockpiling, indicating a generally pessimistic outlook for demand.
- MATERIAL SHORTAGES: Supply shortages have ended, with reports of item scarcity now in line with historically normal levels.
- LABOR SHORTAGES: Labor shortages remain generally unproblematic for global businesses. Some of the issues manufacturers in Europe and North America experienced with respect to staff availability in August receded in September.
- TRANSPORTATION: Global transportation costs fell in September following August’s renewed rise, albeit only slightly.
REGIONAL SUPPLY CHAIN VOLATILITY
- NORTH AMERICA: Index rose to -0.30, from -0.55, its highest since April, hinting at greater odds of a soft landing for the U.S. economy.
- EUROPE: Sharp fall in the index to -1.01, from -0.50, putting it at levels seen during the 2008-2009 global financial crisis. Europe was the principal driver of excess supplier capacity globally in September.
- U.K.: Suppliers to the U.K. continue to see substantial rises in spare capacity. Index fell to -0.98 from -0.92.
- ASIA: Index drops to -0.20, from 0.06, highlighting deteriorating economic conditions in the East after a relatively resilient year-to-date.
For more information, visit www.gep.com/volatility
Note: Full historic data dating back to January 2005 is available for subscription. Please contact economics@spglobal.com.
The next release of the GEP Global Supply Chain Volatility Index will be 8 a.m. ET, Nov. 14, 2023.
ABOUT THE GEP GLOBAL SUPPLY CHAIN VOLATILITY INDEX
The GEP Global Supply Chain Volatility Index is produced by S&P Global and GEP. It is derived from S&P Global’s PMI™ surveys, sent to companies in over 40 countries, totaling around 27,000 companies. The headline figure is a weighted sum of six sub-indices derived from PMI data, PMI Comments Trackers and PMI Commodity Price & Supply Indicators compiled by S&P Global.
- A value above 0 indicates that supply chain capacity is being stretched and supply chain volatility is increasing. The further above 0, the greater the extent to which capacity is being stretched.
- A value below 0 indicates that supply chain capacity is being underutilized, reducing supply chain volatility. The further below 0, the greater the extent to which capacity is being underutilized.
A Supply Chain Volatility Index is also published at a regional level for Europe, Asia, North America and the U.K. For more information about the methodology, click here.
About GEP
GEP® delivers AI-powered procurement and supply chain solutions that help global enterprises become more agile and resilient, operate more efficiently and effectively, gain competitive advantage, boost profitability and increase shareholder value.
Fresh thinking, innovative products, unrivaled domain expertise, smart, passionate people — this is how GEP SOFTWARE™, GEP STRATEGY™ and GEP MANAGED SERVICES™ together deliver procurement and supply chain solutions of unprecedented scale, power and effectiveness. Our customers are the world’s best companies, including more than 550 Fortune 500 and Global 2000 industry leaders who rely on GEP to meet ambitious strategic, financial and operational goals.
A leader in multiple Gartner Magic Quadrants, GEP’s cloud-native software and digital business platforms consistently win awards and recognition from industry analysts, research firms and media outlets, including Gartner, Forrester, IDC, ISG, and Spend Matters.
GEP is also regularly ranked a top procurement and supply chain consulting and strategy firm, and a leading managed services provider by ALM, Everest Group, NelsonHall, IDC, ISG and HFS, among others. Headquartered in Clark, New Jersey, GEP has offices and operations centers across Europe, Asia, Africa and the Americas. To learn more, visit www.gep.com.
About S&P Global
S&P Global (NYSE: SPGI) S&P Global provides essential intelligence. We enable governments, businesses and individuals with the right data, expertise and connected technology so that they can make decisions with conviction. From helping our customers assess new investments to guiding them through ESG and energy transition across supply chains, we unlock new opportunities, solve challenges and accelerate progress for the world. We are widely sought after by many of the world’s leading organizations to provide credit ratings, benchmarks, analytics and workflow solutions in the global capital, commodity and automotive markets. With every one of our offerings, we help the world’s leading organizations plan for tomorrow, today.
Media Contacts
| Derek Creevey Director, Public Relations GEP Phone: +1 732-382-6565 Email: derek.creevey@gep.com |
Joe Hayes Principal Economist S&P Global Market Intelligence T: +44-1344-328-099 Email: joe.hayes@spglobal.com |
Disclaimer
The intellectual property rights to the data provided herein are owned by or licensed to S&P Global and/or its affiliates. Any unauthorised use, including but not limited to copying, distributing, transmitting or otherwise of any data appearing is not permitted without S&P Global’s prior consent. S&P Global shall not have any liability, duty or obligation for or relating to the content or information (“data”) contained herein, any errors, inaccuracies, omissions or delays in the data, or for any actions taken in reliance thereon. In no event shall S&P Global be liable for any special, incidental, or consequential damages, arising out of the use of the data. Purchasing Managers’ Index™ and PMI™ are either registered trademarks of Markit Economics Limited or licensed to Markit Economics Limited and/or its affiliates.
This Content was published by S&P Global Market Intelligence and not by S&P Global Ratings, which is a separately managed division of S&P Global. Reproduction of any information, data or material, including ratings (“Content”) in any form is prohibited except with the prior written permission of the relevant party. Such party, its affiliates and suppliers (“Content Providers”) do not guarantee the accuracy, adequacy, completeness, timeliness or availability of any Content and are not responsible for any errors or omissions (negligent or otherwise), regardless of the cause, or for the results obtained from the use of such Content. In no event shall Content Providers be liable for any damages, costs, expenses, legal fees, or losses (including lost income or lost profit and opportunity costs) in connection with any use of the Content.
Media contact