Weak Global Demand and Spare Capacity at Global Suppliers Persist in August as Global Economy Flirts With Recession: GEP Global Supply Chain Volatility Index
- Increasing oil prices push up transportation costs to their highest since February
- Excess supplier capacity reflects a persistent subdued economic environment, with Europe at the epicenter of the downturn
- In contrast, resilience seen in Asia, driven by demand rising strongly in India, Indonesia and Vietnam
- More European and North American manufacturers are reporting a rise in backlogs due to staff shortages
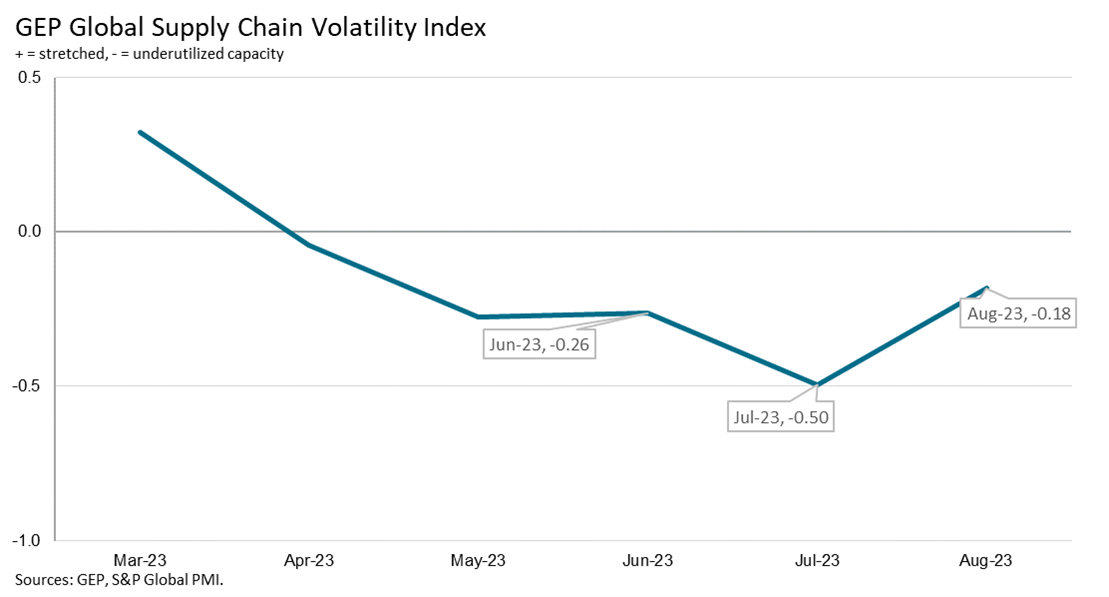
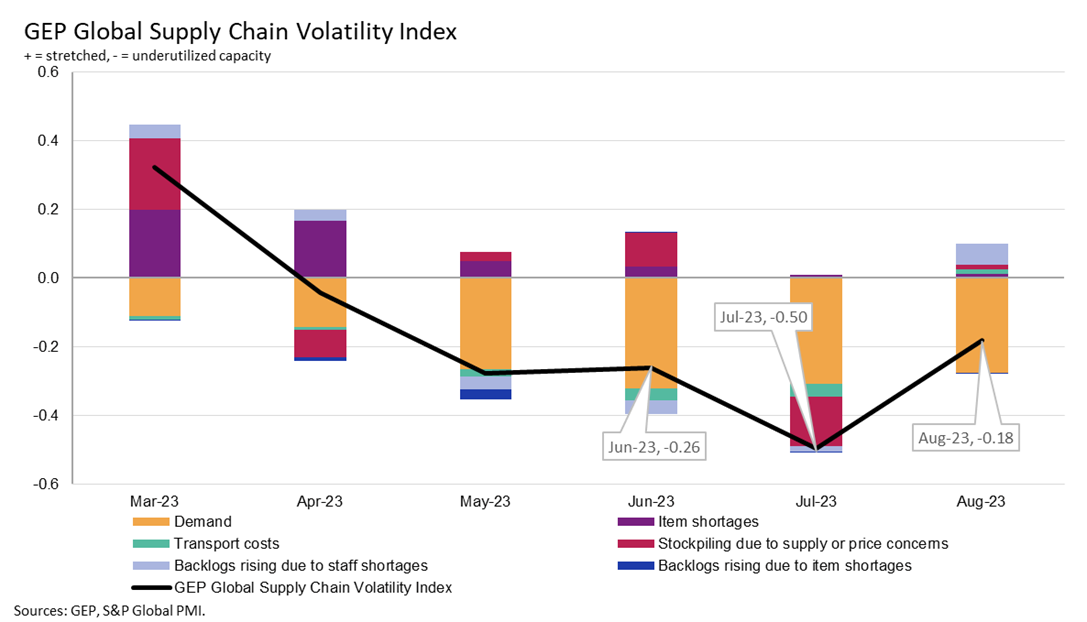
Clark, N.J., Sept. 13, 2023 – The GEP Global Supply Chain Volatility Index — a leading indicator tracking demand conditions, shortages, transportation costs, inventories and backlogs based on a monthly survey of 27,000 businesses — recorded -0.18 in August (vs. -0.50 in July), showing sustained idle capacity at global suppliers as demand conditions remained subdued and procurement managers stayed cautious.
August is the 14th successive month in which global demand displayed weakness, reflecting the brittle global economic environment. Conditions are their most fragile in Europe, where demand continues to fall drastically, and recession risks appear their most prominent. Demand also fell considerably across North America in August, indicating a slowing economy. In contrast, demand conditions are more stable in Asia, despite the slow Chinese economy, with purchasing rising strongly in India, Indonesia and Vietnam.
Notably, global transportation costs rose to their highest level since February amid renewed pressures on fuel prices as oil producers announced cuts to supply. U.S. and European manufacturers are also experiencing some renewed pressures arising from staff shortages due to tight labor markets and wage pressures.
Commenting on the August data, Neha Shah, president, GEP, said: “Our data shows that we’re currently on a fine line hovering between recession and stagnation. Despite many months of excess global supply and subdued demand, companies can expect rising costs from petrochemicals industries, shortages of certain commodities, including sugar, rice, and wheat, and also wage pressures in some sectors because of the effective collective bargaining by employees.”
Interpretating the data:
- Index > 0, supply chain capacity is being stretched. The further above 0, the more stretched supply chains are.
- Index < 0, supply chain capacity is being underutilized. The further below 0, the more underutilized supply chains are.
August 2023 Key Findings:
- DEMAND: Demand for raw materials, commodities and components continues to deteriorate at a similar pace to that seen in the other summer months, with little improvement seen at all in 2023. Europe led the downturn in purchasing, followed by North America.
- INVENTORIES: Global businesses continue to demonstrate little appetite for building up their stocks, with inventory managers unwilling to hold surplus stock.
- MATERIALS SHORTAGES: Supply shortages have ended, with reports of item scarcity now in line with historically normal levels.
- LABOR SHORTAGES: Labor shortages are having a limited impact on companies’ ability to meet global demand, although manufacturers in Europe and North America have experienced some renewed issues with staff availability.
- TRANSPORTATION: Having fallen to their lowest since January 2016 in July, global transportation costs ticked higher in August amid rising pressures on oil prices.
REGIONAL SUPPLY CHAIN VOLATILITY
- NORTH AMERICA: Index fell to -0.55 from -0.37 as demand for materials worsened and firms destocked again.
- EUROPE: Index rose from the global financial crisis low in July of -1.07 to -0.50, but nonetheless indicates a marked rise in supplier spare capacity.
- U.K.: Index was little changed in August at -0.92, versus -1.01 in July as the struggling European economy hits U.K. suppliers.
- ASIA: Index rose to 0.06, from -0.31, signalling a faint uptick in Asian supply chain volatility compared to July.
For more information, visit www.gep.com/volatility
Note: Full historic data dating back to January 2005 is available for subscription. Please contact economics@spglobal.com.
The next release of the GEP Global Supply Chain Volatility Index will be 8 a.m. ET, October 13, 2023.
ABOUT THE GEP GLOBAL SUPPLY CHAIN VOLATILITY INDEX
The GEP Global Supply Chain Volatility Index is produced by S&P Global and GEP. It is derived from S&P Global’s PMI™ surveys, sent to companies in over 40 countries, totaling around 27,000 companies. The headline figure is a weighted sum of six sub-indices derived from PMI data, PMI Comments Trackers and PMI Commodity Price & Supply Indicators compiled by S&P Global.
- A value above 0 indicates that supply chain capacity is being stretched and supply chain volatility is increasing. The further above 0, the greater the extent to which capacity is being stretched.
- A value below 0 indicates that supply chain capacity is being underutilized, reducing supply chain volatility. The further below 0, the greater the extent to which capacity is being underutilized.
A Supply Chain Volatility Index is also published at a regional level for Europe, Asia, North America and the U.K. For more information about the methodology, click here.
About GEP
GEP® delivers AI-powered procurement and supply chain solutions that help global enterprises become more agile and resilient, operate more efficiently and effectively, gain competitive advantage, boost profitability and increase shareholder value.
Fresh thinking, innovative products, unrivaled domain expertise, smart, passionate people — this is how GEP SOFTWARE™, GEP STRATEGY™ and GEP MANAGED SERVICES™ together deliver procurement and supply chain solutions of unprecedented scale, power and effectiveness. Our customers are the world’s best companies, including more than 550 Fortune 500 and Global 2000 industry leaders who rely on GEP to meet ambitious strategic, financial and operational goals.
A leader in multiple Gartner Magic Quadrants, GEP’s cloud-native software and digital business platforms consistently win awards and recognition from industry analysts, research firms and media outlets, including Gartner, Forrester, IDC, ISG, and Spend Matters.
GEP is also regularly ranked a top procurement and supply chain consulting and strategy firm, and a leading managed services provider by ALM, Everest Group, NelsonHall, IDC, ISG and HFS, among others. Headquartered in Clark, New Jersey, GEP has offices and operations centers across Europe, Asia, Africa and the Americas. To learn more, visit www.gep.com.
About S&P Global
S&P Global (NYSE: SPGI) S&P Global provides essential intelligence. We enable governments, businesses and individuals with the right data, expertise and connected technology so that they can make decisions with conviction. From helping our customers assess new investments to guiding them through ESG and energy transition across supply chains, we unlock new opportunities, solve challenges and accelerate progress for the world. We are widely sought after by many of the world’s leading organizations to provide credit ratings, benchmarks, analytics and workflow solutions in the global capital, commodity and automotive markets. With every one of our offerings, we help the world’s leading organizations plan for tomorrow, today.
Media Contacts
| Derek Creevey Director, Public Relations GEP Phone: +1 732-382-6565 Email: derek.creevey@gep.com |
Joe Hayes Principal Economist S&P Global Market Intelligence T: +44-1344-328-099 Email: joe.hayes@spglobal.com |
Disclaimer
The intellectual property rights to the data provided herein are owned by or licensed to S&P Global and/or its affiliates. Any unauthorised use, including but not limited to copying, distributing, transmitting or otherwise of any data appearing is not permitted without S&P Global’s prior consent. S&P Global shall not have any liability, duty or obligation for or relating to the content or information (“data”) contained herein, any errors, inaccuracies, omissions or delays in the data, or for any actions taken in reliance thereon. In no event shall S&P Global be liable for any special, incidental, or consequential damages, arising out of the use of the data. Purchasing Managers’ Index™ and PMI™ are either registered trademarks of Markit Economics Limited or licensed to Markit Economics Limited and/or its affiliates.
This Content was published by S&P Global Market Intelligence and not by S&P Global Ratings, which is a separately managed division of S&P Global. Reproduction of any information, data or material, including ratings (“Content”) in any form is prohibited except with the prior written permission of the relevant party. Such party, its affiliates and suppliers (“Content Providers”) do not guarantee the accuracy, adequacy, completeness, timeliness or availability of any Content and are not responsible for any errors or omissions (negligent or otherwise), regardless of the cause, or for the results obtained from the use of such Content. In no event shall Content Providers be liable for any damages, costs, expenses, legal fees, or losses (including lost income or lost profit and opportunity costs) in connection with any use of the Content.
Media contact